Trans-Pacific Partnership: What’s in it for Canada?
The Trans-Pacific Partnership (TPP) was conceived in 2003 by Singapore, New Zealand and Chile to enhance economic integration in the Asia-Pacific region. Since then, the negotiations have expanded to include Brunei, the US, Peru, Australia, Vietnam, Malaysia, Canada, Mexico and most recently, Japan. A number of other countries have expressed interest in joining the negotiations including South Korea, the Philippines, Laos, Colombia, Indonesia, Cambodia, Bangladesh, Thailand and India.
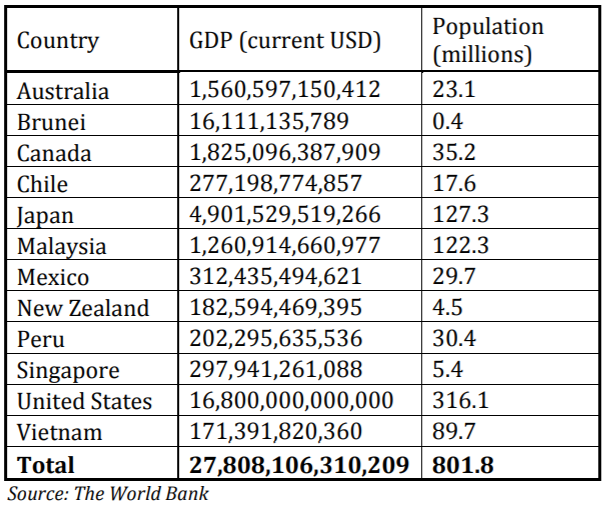
In 2013, TPP members had a combined GDP of nearly $28 trillion USD. The consumer market potential is huge with TPP countries home to over 800 million people. Economic modelling estimates that the TPP could yield annual income gains of $9.9 billion USD for Canada and increase exports by $15.7 billion USD.
TPP Market Potential, 2013
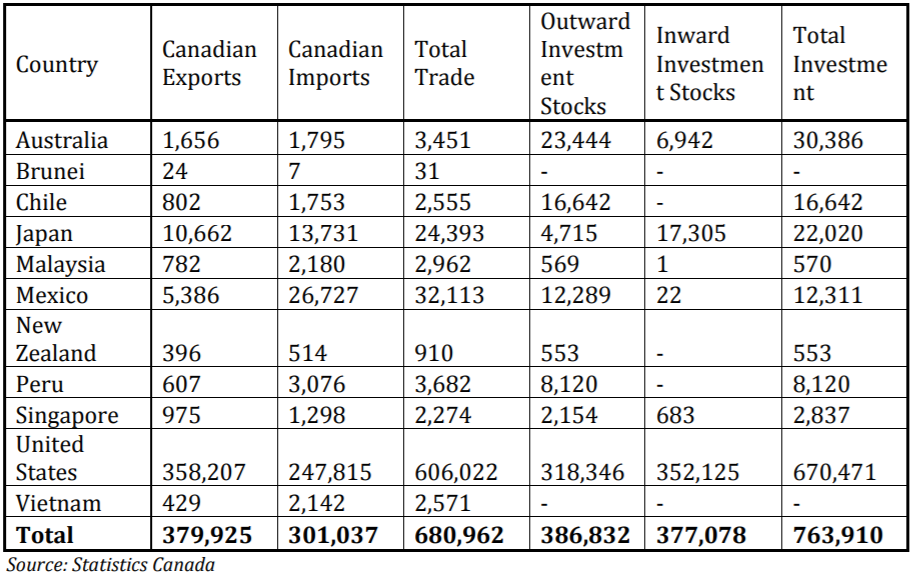
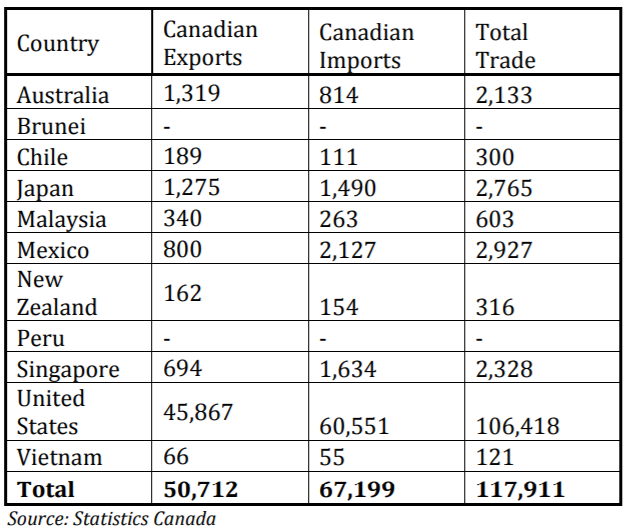
Canada’s total bilateral merchandise trade with TPP members was worth $681 billion in 2013, representing 72 per cent of Canada’s total bilateral trade that year. TPP countries are also a significant source of both inward and outward stocks of Canadian investment with two-way investment of over $764 billion in 2013.
Canadian Trade and Investment – TPP Members (millions), 2013
An important and often overlooked component of Canada’s trade with the world is the growing importance of Canada’s services trade. The services sector accounts for 72 per cent of Canadian GDP, 75 per cent of employment and 90 per cent of new job creation. Canada exported nearly $84 billion in services internationally in 2011, with services exports to TPP members growing by 8% between 2007 and 2011.
Canadian Services Trade – TPP Members (millions), 2011

Why the TPP Matters
One in five Canadian jobs depends on exports. According to the federal government’s 2012 report Canada’s State of Trade, exports account for 26.1 per cent of Canada’s gross domestic product (GDP).
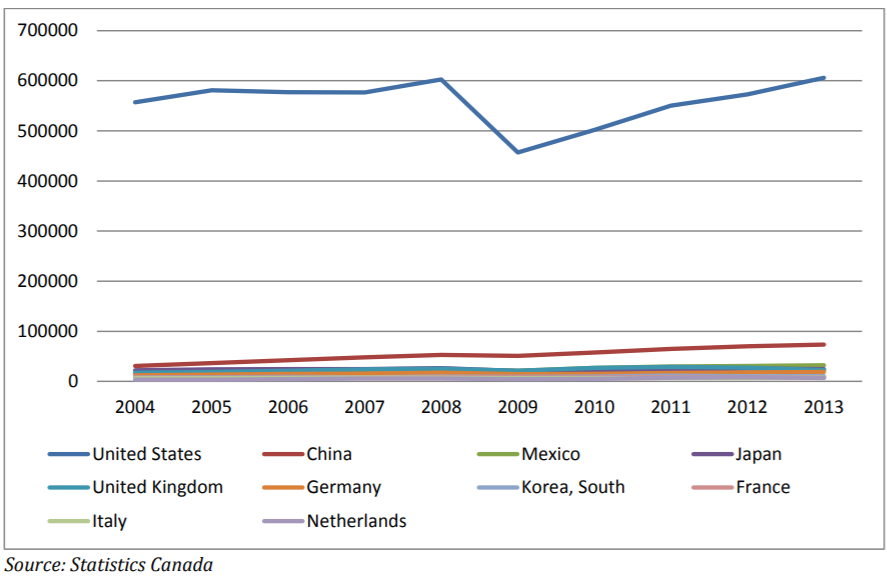
But Canada’s trade outside of North America is low and poorly diversified. The US remains Canada’s largest trading partner by a wide margin, responsible for 64 per cent of Canada’s total bilateral trade.
Canada’s Top Merchandise Trade Partners (millions of CAD)
The Bank of Canada has repeatedly warned of the need for Canada to diversify export markets. In a recent speech to the Saskatchewan Trade and Export Partnership, Governor Poloz noted that while there is no doubt than an improving US economy is good for Canada “the growth potential of emerging-market economies is projected to be about four times that of the world’s advanced economies”.
Over the next twenty years, Asia’s middle class will generate significant increases in demand for energy and natural resources, financial services, education, cleaner technology and environmental improvements. In fact, by 2030, 66 per cent of the global middle class is projected to live in the Asia Pacific region.
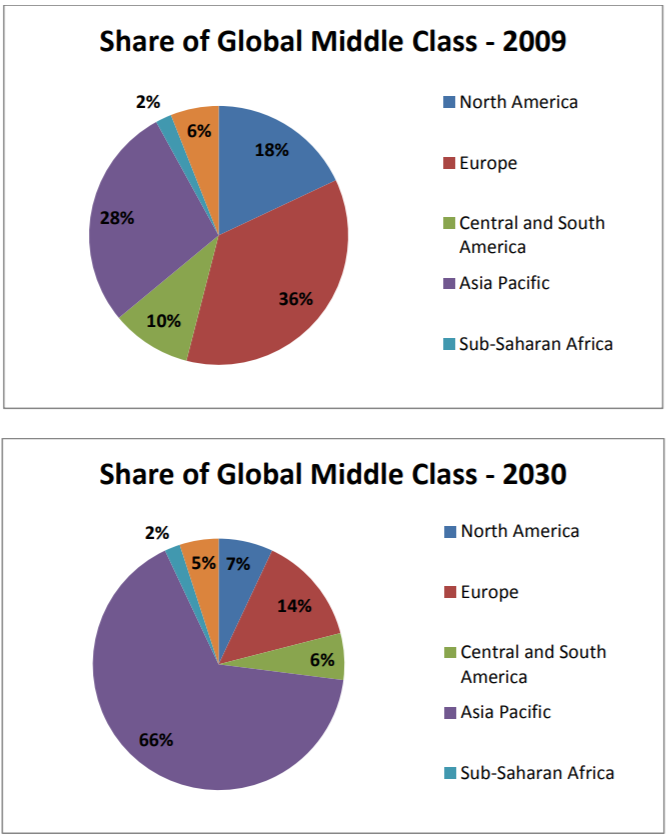
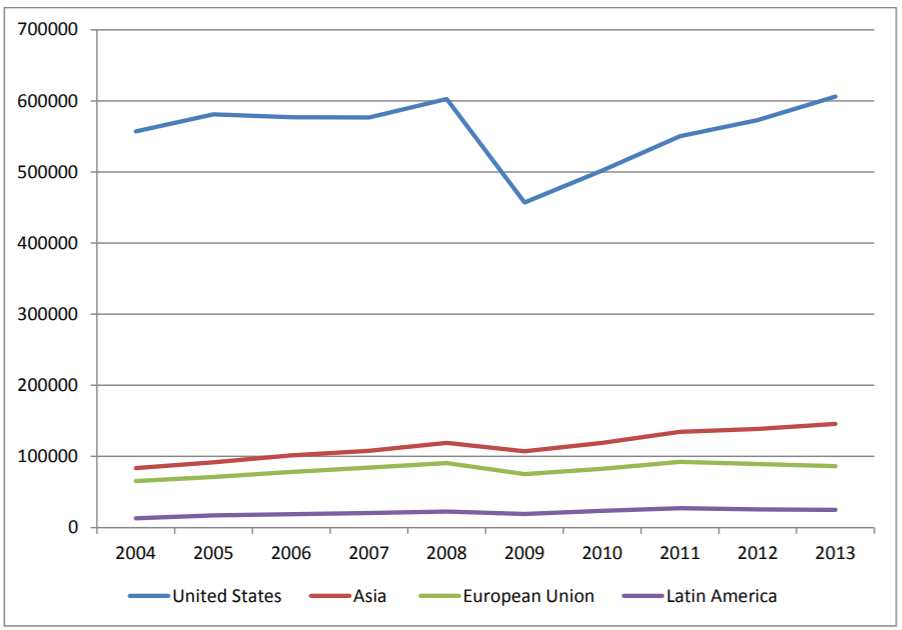
Canada is not well positioned to take advantage of massive urbanization and the rapid growth in the ranks of Asia’s middle class consumers. Asia is responsible for 15 per cent of Canada’s total bilateral trade. While this has grown from 11 per cent in 2011, it still pales in comparison to Canada’s trade with the US. If Canada is to take advantage of the Pacific Century, trade and investment liberalization must be a priority.
Canadian Regional Trade Relationships
Canada has only one trade agreement in Asia with South Korea. More needs to be done. With its current members, the TPP region is responsible for approximately 40% of the world’s economic output. More importantly, the TPP has the potential to expand to include other major economies in the Asia-Pacific region. Concluding an ambitious, high quality TPP agreement is the most efficient way for Canada to deepen its integration with other Asian economies and take advantage of Asia’s fastgrowing markets.

Canada’s Opportunity
The market opportunities for Canada in the TPP are primarily in those countries where Canada does not have existing free trade agreements – Australia, Brunei, Japan, Malaysia, New Zealand, Singapore and Vietnam.
Australia, Brunei, Japan, Malaysia, New Zealand, Singapore and Vietnam had a combined GDP of $8.4 trillion USD in 2013 and a population of 278 million. Of these countries, Japan provides the most significant opportunities for Canadian businesses due to GDP and population size.
Vietnam and Malaysia have the potential to become important markets for Canadian businesses given projected growth rates. According to the International Monetary Fund, both countries will witness GDP growth of 5 percent or higher through to 2019.
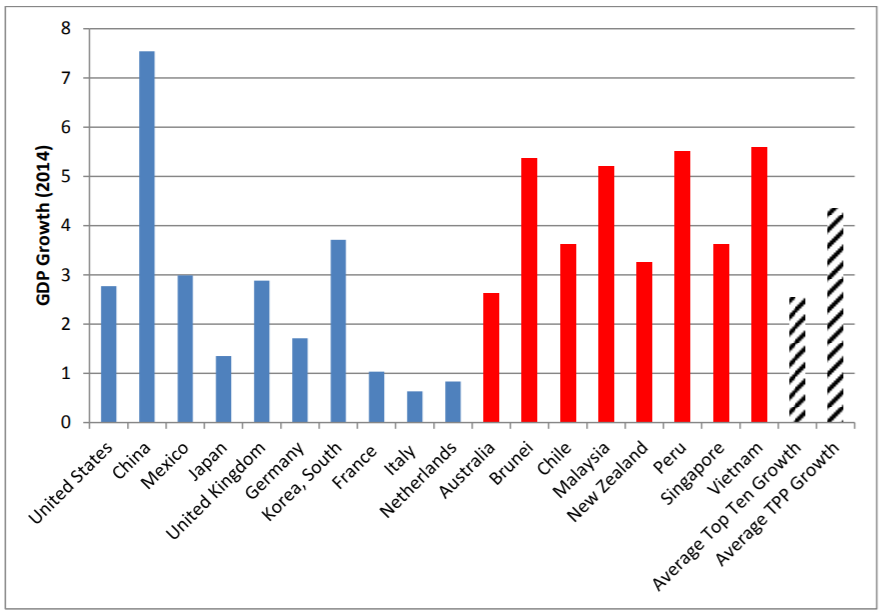
Canada’s top ten bilateral trade partners (blue) are responsible for 86% of Canada’s total trade. The average projected growth rate of these countries for 2014 is 2.5 per cent. The TPP countries (red) are responsible for only 1.8 per cent of Canada’s total trade yet have an average projected growth rate of 4.4 per cent in 2014. With the exception of China and South Korea, Canada’s trade is concentrated in slow growth economies.
Projected GDP Growth – Canada’s Top Ten Trading Partners vs TPP Countries
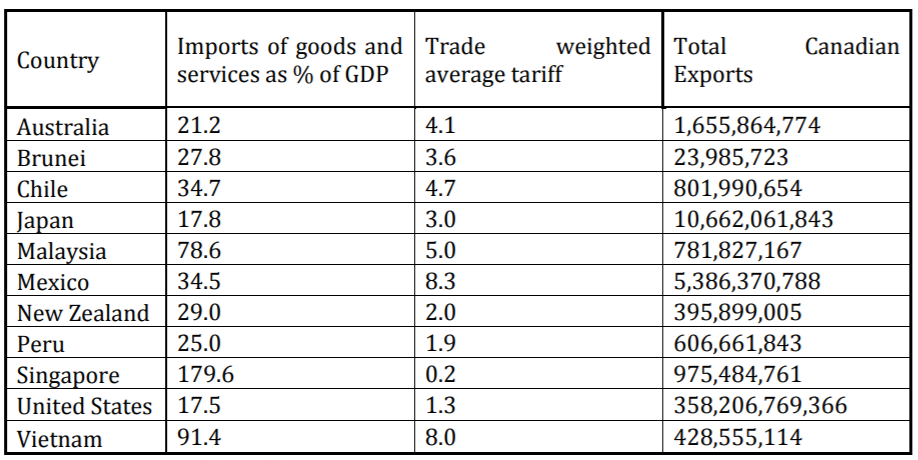
While most markets have relatively low levels of traditional trade protection, Japan offers Canada the most new market potential with an average trade weighted tariff of 3 per cent and low import penetration (17.8% of GDP). Vietnam and Malaysia also offer Canada new export opportunities given rapid growth projections and higher levels of import protection when compared to other TPP members.
Trade Openness
Significant gains for Canada in these markets will also come from improvements in the business climate. The TPP provides an opportunity for developing economies to adopt transparent and non-discriminatory policies that will improve market efficiency.
Market Freedom
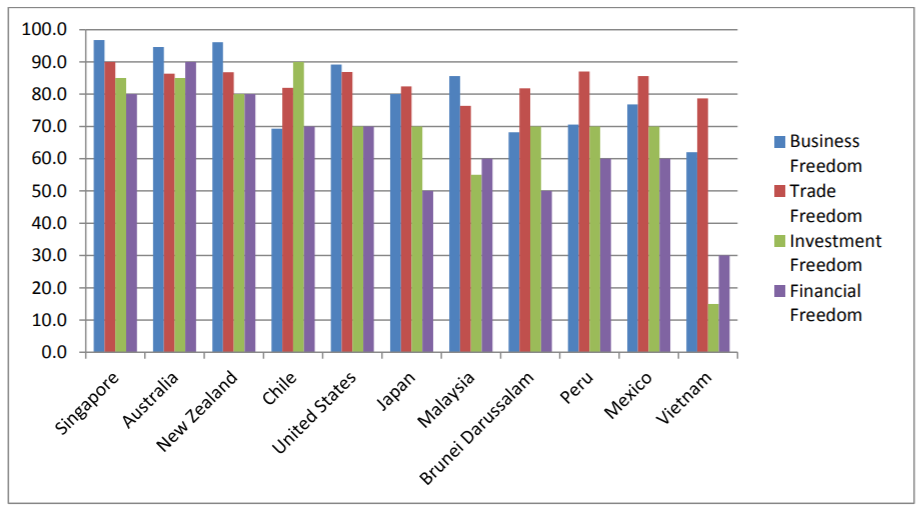
Singapore, Australia, New Zealand, Chile, the US and Japan are among the world’s top 25 freest economies according to the 2014 Index of Economic Freedom. These economies have high levels of business, trade, investment and financial freedom.
Malaysia, Brunei, Peru, Mexico and Vietnam rank lower in the index. The TPP has the potential to improve both the regulatory framework that influences business freedom and the level of openness in the market. Domestic reforms that enhance market freedom will provide greater certainty for Canadian businesses trading with or investing in these economies.


