


Sixth Annual Total Tax Contribution Survey
Economic growth bolsters public finances
Foreword
Economic growth bolsters public finances
The sixth annual Total Tax Contribution survey, which included more than half of the Business Council of Canada’s 150 members for the 2017 fiscal year, provides new insight into the role that large Canadian businesses play in supporting public finances, driving investment, and providing good middle-class jobs.
With a three per cent growth rate, 2017 saw the Canadian economy reach its fastest pace in six years, leading all other Group of Seven (G7) countries by a wide margin. The strength of the Canadian economy was also reflected in the profitability of some of Canada’s most important businesses, and led to a significant year-over-year increase in tax receipts – $76.8 billion, $8.5 billion more than in 2016 and $13 billion higher than in 2015.
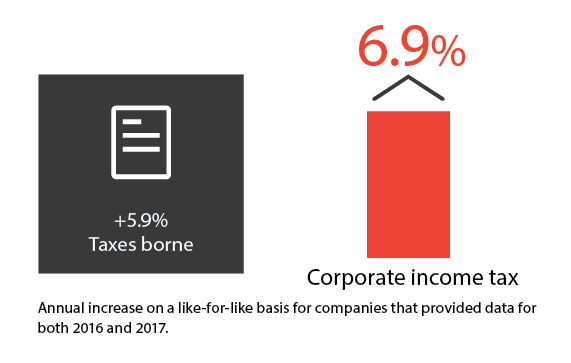
This survey provides further evidence that economic growth and profitability increase the contribution that businesses, especially large enterprises, provide to the revenue streams of governments at all levels. 2017 saw a 5.9 per cent overall increase in taxes borne compared to the previous year, of which 6.9 per cent was attributable to corporate income tax. This group of businesses contributed 16.9 per cent of total federal corporate income tax revenues ($8.1 billion) and 19.5 per cent of total provincial corporate income tax revenues ($6.1 billion).
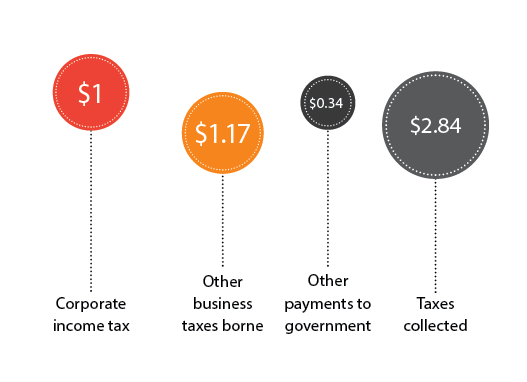
It is important to note that corporate income tax is only one of 68 different taxes, fees and royalties, that large Canadian companies pay to the three levels of government. For every dollar paid in corporate income tax, companies surveyed paid another $1.17 in other business taxes and $0.34 in other payments to government. An additional $2.84 is contributed through taxes collected from customers and employees.
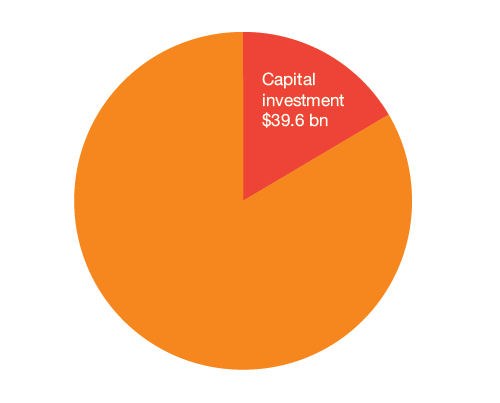
Council members are also responsible for a significant share of capital investment that bolsters Canada’s future economic capacity. Survey participants were responsible for $39.6 billion in capital investment with leading contributors coming from the technology and communications, forestry and mining, and oil and gas sectors.
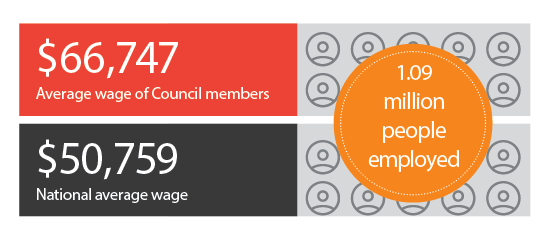
Finally, this group of businesses play a key role in supporting good middle-class jobs. The 83 companies surveyed employed more than 1 million Canadians and pay an average wage of nearly $67,000, which is 32 per cent higher than the national average.
In the context of public discussions around the impact economic growth has on ensuring a future of good jobs and a high quality of life for all Canadians, this survey provides meaningful data to inform constructive debate and contribute to forward-thinking policy reform. In particular, it demonstrates the urgent need for a comprehensive review of the tax system across the country with an eye to boosting Canada’s overall global competitiveness.

Peter van Dijk, PwC Canada

Andrew Packman, PwC UK
Key Findings
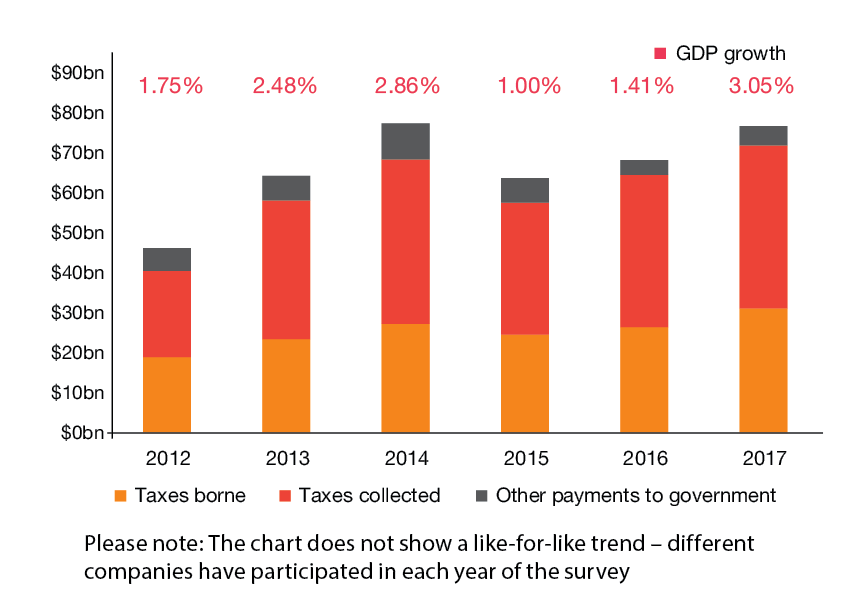
Total Tax Contribution and other payments as compared with annual GDP growth, 2012-2017
The Canadian economy grew strongly in 2017, reaching its fastest pace in six years. Building from a year of stagnant nominal GDP growth in 2015, total payments have returned to the levels experienced in 2014, highlighting that GDP growth is reflected in the Total Tax Contribution (TTC) of Canada’s most established businesses.
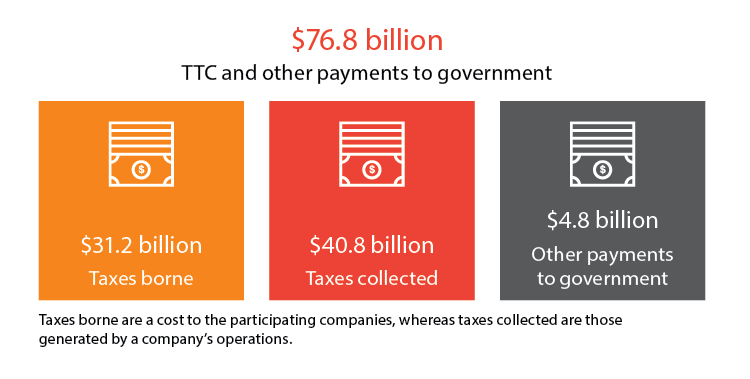
Total Tax Contribution
The Total Tax Contribution for the survey participants in 2017 was $72.0 billion: $31.2 billion in taxes borne and $40.8 billion in taxes collected. Participants made a further $4.8 billion in other payments, such as royalties.
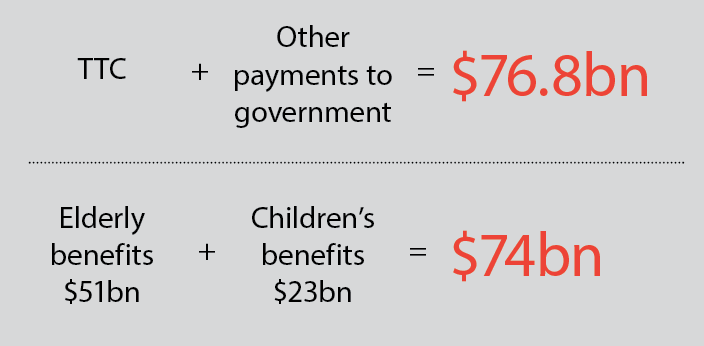
Contributions in the context of social spending
To put this figure in context, the tax contributions and other payments by these 83 businesses in 2017 were greater than total federal spending in the 2017-2018 fiscal year on key social programs related to elderly benefits ($51 billion) and children’s benefits ($23 billion) combined.
With a stronger economy in 2017, there was an increase in taxes borne and corporate income tax
The overall increase in taxes borne (up 5.9% compared to 2016) was driven by an increase in corporate income tax (accounting for 6.9%), primarily driven by the banks and FS companies that participated in the study. The increase in corporate income tax reflects increasing profits compared to 2016.
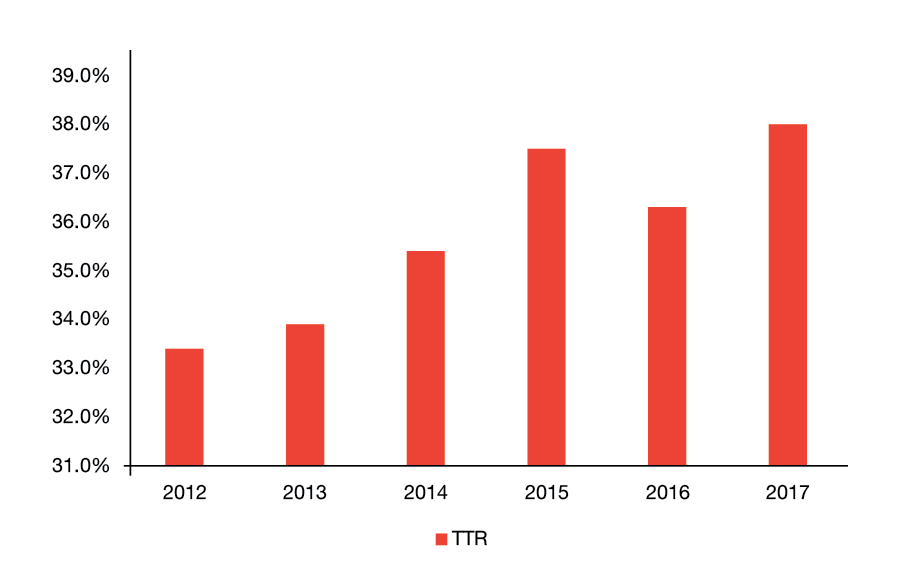
Total Tax Rate, 2012-2017
The Total Tax Rate is a measure of the total tax burden of participants. The calculation is total taxes borne – corporate income tax plus all other taxes borne – as a percentage of profit before taxes borne. On average, the participants were subject to a TTR of 38.0% (2016: 36.3%).
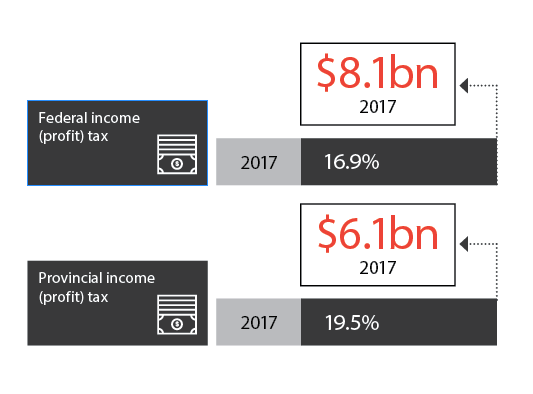
Responsible for a significant share of total federal and provincial corporate income tax
Survey participants contributed 16.9% ($8.1 billion) of total federal corporate income tax revenue. They also contributed 19.5% of provincial corporate income tax revenue ($6.1 billion).
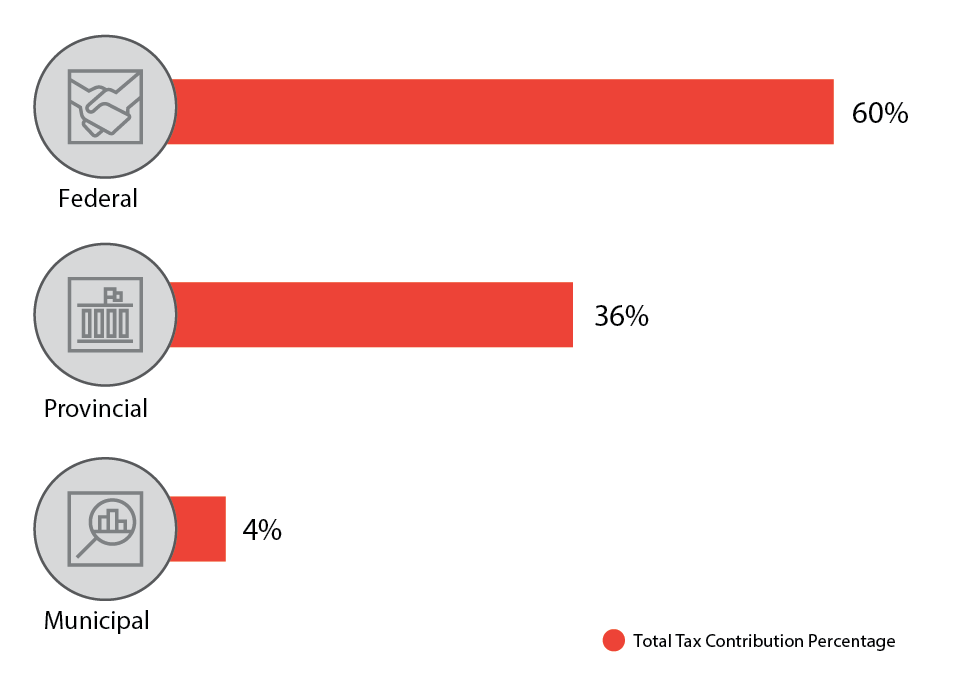
Total Tax Contribution by level of government
Federal taxes account for 60% of the Total Tax Contribution of the companies surveyed. In total, this federal tax revenue was collected from 19 different taxes, representing 34% of the total number of taxes paid by participants.
At the provincial level, 36% of the Total Tax Contribution was collected from 32 different taxes, representing 57% of the total number of taxes paid by participants.
The remaining 4% of the Total Tax Contribution was collected through municipal taxes.
Council members are an important source of well-paid jobs in Canada
The survey participants provided employment to 1,096,620 people and paid an average wage of $66,747 (32% higher than the national average of $50,759). They also contributed an average of $24,443 in employment taxes per employee, reflecting taxes borne by the participants and collected on behalf of employees.
Council members contribute significant levels of capital investment
Survey participants contributed $39.6 billion of capital investment, 16.5% of total business investment in Canada (leading sectors: technology and communications, forestry and mining, and oil and gas)
Corporate income tax is not the only tax paid
For every dollar of corporate income tax, the survey participants paid a further $1.17 (2016: $1.08) of other business taxes and $0.34 in other payments to government. For every dollar of corporate income tax paid by the participants, there was another $2.84 (2016: $3.01) in taxes collected.
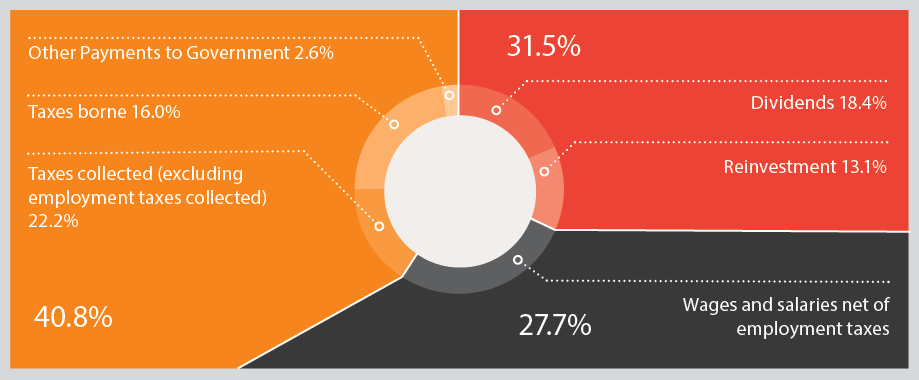
40.8% of the value distributed goes to the government in taxes and payments
Value is distributed to the government in taxes and other payments to government, to employees in wages and salaries, and profit is distributed to shareholders or retained in the business for reinvestment. In 2017, the government was the largest beneficiary of the value distributed by the survey participants, at 40.8% of the total.
Related

The Surprising Facts About Business & Tax
August 4, 2016
Fifth Annual Total Tax Contribution Survey
May 14, 2018
About
Business Council of Canada
Founded in 1976, the Business Council of Canada is a not-for-profit, non-partisan organisation representing business leaders in every region and sector of the country. The Council’s member companies employ 1.7 million Canadians, contribute the largest share of federal corporate taxes, and are responsible for most of Canada’s exports, corporate philanthropy, and private-sector investments in research and development. Through supply chain partnerships, service contracts and mentoring programs, Business Council members support many hundreds of thousands of small businesses and entrepreneurs in communities of all sizes, in every part of Canada. Please connect with us on LinkedIn or Twitter and subscribe to our recently launched podcast, Speaking of Business.
PwC
PwC Canada helps organisations and individuals create the value they’re looking for. More than 6,700 partners and staff in offices across the country are committed to delivering quality in assurance, tax, consulting and deals services. PwC Canada is a member of the PwC network of firms with over 250,000 people in 158 countries. Find out more by visiting us at www.pwc.com/ca
Total Tax Contribution
The Total Tax Contribution methodology identifies taxes borne and taxes collected. Taxes borne by a company are a cost to the company and reflected in its financial results, e.g. federal and provincial corporate income (profit) tax and irrecoverable sales taxes.
Taxes collected are those generated by a company’s operations, but which do not affect its results, e.g. payroll taxes withheld from employees and remitted and GST/HST collected from customers and remitted.
We identified 68 business taxes and other payments to governments in this survey under the Total Tax Contribution methodology. Taxes are categorised into five tax bases, i.e. profit taxes, production taxes, employment taxes, property taxes and environmental taxes.