


Seventh Annual Canadian Total Tax Contribution Survey
Seven-year analysis of TTC trends
Foreword
The seventh annual Total Tax Contribution (TTC) survey of the Business Council of Canada’s members analyses data received for the 2018 fiscal year from 78 of Canada’s largest businesses. 2018 was another strong year of economic growth in Canada despite the potential negative impact of US tax reform and the uncertainty created by the renegotiation of the North American Free Trade Agreement (NAFTA). As with prior surveys, the data presented in this report is from a year and a half ago to allow time to collect, analyze and report on the data.
The economic buoyancy of 2018 was reflected in a 3.4% increase in the total tax contribution, on a like-for-like basis, compared to the previous year. The total contribution of $76.7 billion was made up of $30.4 billion of taxes borne, $41.4 billion of taxes collected and $4.9 of other payments to government, such as royalties.
In addition to the significant contribution these large businesses make to Canada’s public finances, the report also demonstrates their wider economic contribution. The survey participants employ over one million people and pay an average wage that is 34% higher than the national average. They were responsible for $42.7 billion of capital investment, which represented 17% of total national business investment in 2018.
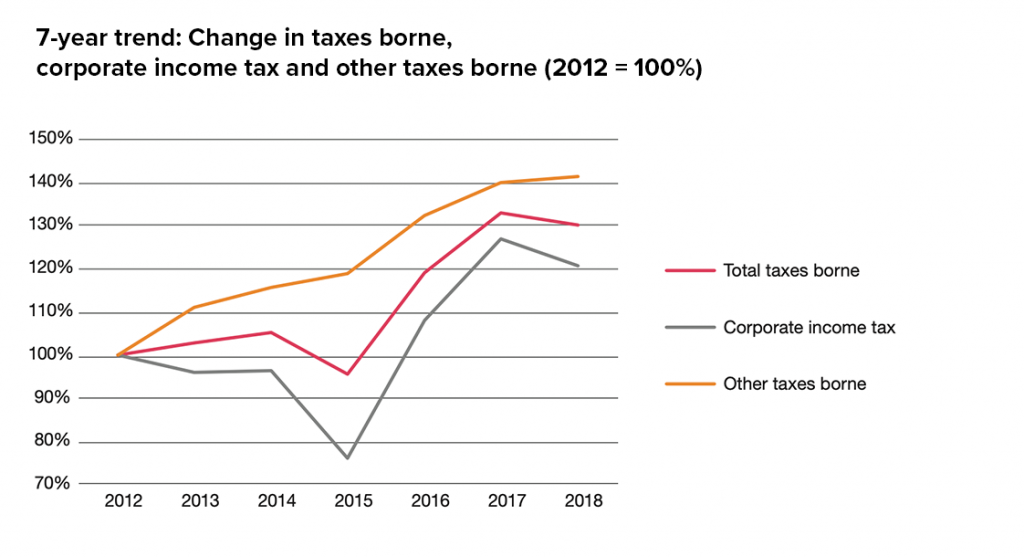
New in this year’s report is a trend analysis since the survey began in 2012. The analysis reveals that taxes borne, for the 30 companies that have participated in each of the seven surveys, have increased by 30% since 2012. While corporate income taxes paid have fluctuated over this period, in line with economic growth and trends in profitability, other taxes borne have increased consistently to provide a reliable source of revenue for the government.
The seven-year trend shows the contrasting performance of the other two elements of the total contribution: taxes collected and other payments to government. Taxes collected have increased by 40% between 2012 and 2018, and have also been a consistent source of government revenue. Other payments to the government, such as royalties, are more dependent on natural resource prices, and therefore have had a tendency to be more volatile, providing an inconsistent revenue source.
The survey highlights the complexity of Canada’s tax system, with large Canadian companies paying 68 different taxes, fees and royalties to three levels of government. The survey shows that businesses pay more non-income taxes and fees than corporate income tax. For every dollar paid in corporate income tax, the companies surveyed paid another $1.04 in other business taxes and $0.33 in other payments to the government. An additional $2.77 is contributed through taxes collected from customers and employees.
The insights provided by this report underscore the important role that large Canadian businesses play in economic growth and stability, by supporting public finances and creating good jobs for all segments of society. This survey provides objective evidence that governments should ensure that the environment for Canadian businesses enables them to be successful and profitable. That will improve Canada’s overall global competitiveness and provide a reliable source of government revenue.
We thank the Business Council of Canada for continuing to support this survey, and encourage business leaders and other stakeholders to engage with the tax agenda in the future.

Vik Sachdev, PwC Canada

Andrew Packman, PwC UK
Key Findings
Total Tax Contribution
The Total Tax Contribution for the survey participants in 2018 was $71.7 billion: $30.4 billion in taxes borne and $41.4 billion in taxes collected. Participants made a further $4.9 billion in other payments, such as royalties.

With economic growth remaining strong in 2018, profits and corporate income tax both increased
The overall increase in taxes borne (up 1.5% compared to 2017) was driven by an increase in corporate income tax (up 2.5%).

Total Tax Rate
The Total Tax Rate is a measure of the total tax burden of participants. The calculation is total taxes borne – corporate income tax plus all other taxes borne – as a percentage of profit before taxes borne. On average, the participants were subject to a TTR of 38.6% in 2018 (2017: 38.0%).

An increasing contribution in 2018
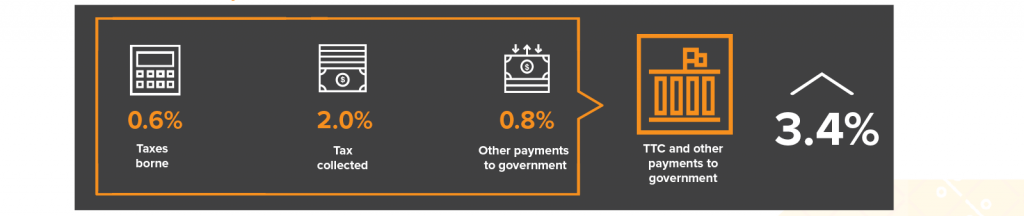
On a like-for-like basis, TTC and other payments to government in 2018 have increased compared to 2017 by 3.4%. This is made up of increases in taxes borne (0.6 percentage points), taxes collected (2.0 percentage points), and other payments to government (0.8 percentage points).
Responsible for a significant share of total federal and provincial corporate income tax
Survey participants contributed 17.3% ($8.7 billion) of total federal corporate income tax revenue in 2018-19. They also contributed 16.0% of total provincial corporate income tax revenue ($6.2 billion).

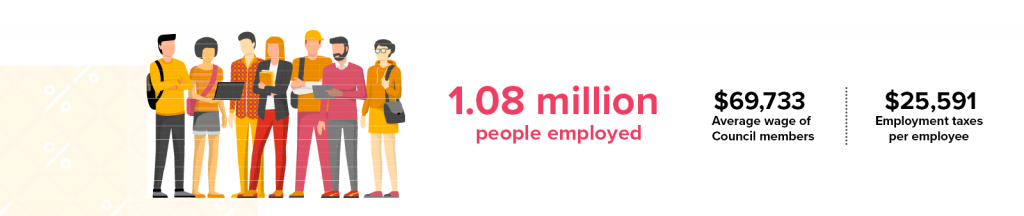
Council members are an important source of well-paid jobs in Canada
The survey participants provided employment to more than one million people (1.08m) and paid an average wage of $69,733 (34% higher than the national average wage of $52,067). They also contributed an average of $25,591 in employment taxes per employee, reflecting taxes borne by the participants and collected on behalf of employees.
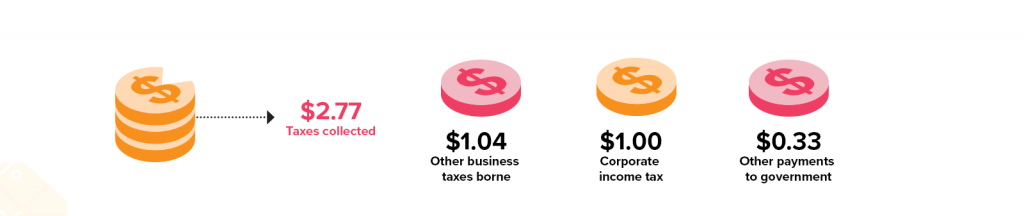
Corporate income tax is not the only tax paid
For every dollar of corporate income tax, the survey participants paid a further $1.04 of other business taxes and $0.33 in other payments to government. For every dollar of corporate income tax paid by the participants, there was another $2.77 in taxes collected.
39.3% of the value distributed goes to the government in taxes borne, taxes collected and other payments
Value is distributed to the government in taxes and other payments, to employees in wages and salaries, and profit is distributed to shareholders or retained in the business for reinvestment. In 2018, the government was the largest beneficiary of the value distributed by the survey participants, at 39.3% of the total.

Council members contribute significant levels of capital investment
Survey participating companies contributed $42.7 billion of capital investment in 2018 (2017: $39.6 billion), 17.4% of total business investment in Canada.

Total Tax Contribution by level of government
Federal taxes account for 60% of the Total Tax Contribution of the companies surveyed. In total, this federal tax revenue was collected from 19 different taxes, representing 34% of the total number of taxes paid by participants.
At the provincial level, 34% of the Total Tax Contribution was collected from 32 different taxes, representing 57% of the total number of taxes paid by participants.
The remaining 6% of the Total Tax Contribution was collected through municipal taxes.

Key findings: 7-year trends
30 companies have provided data in each of the seven surveys, from 2012 to 2018. This enables us to look at 7-year trends on a like-for-like basis.
- Taxes borne have increased by 30% between 2012 and 2018, while taxes collected increased by 40%.
- The increase in taxes borne over this period has been driven by other taxes borne, which have increased by 41% since 2012. Corporate income tax has increased by 21% over this period and, being dependent on profits, has been a more volatile source of tax revenue for the government. The dip in 2015 was a result of weak economic growth, leading to lower profits and lower corporate income tax payments.
- Other payments to government are more dependent on commodity prices, and are therefore a more volatile source of tax revenue for the government, compared to taxes borne and collected.
- The increasing TTC trend over the seven years was interrupted in 2015, when falling commodity prices led to weak GDP growth. The Canadian economy picked up again in 2016 and registered strong growth in 2017 and 2018. In 2018, TTC + OPG are 37% higher than in 2012.
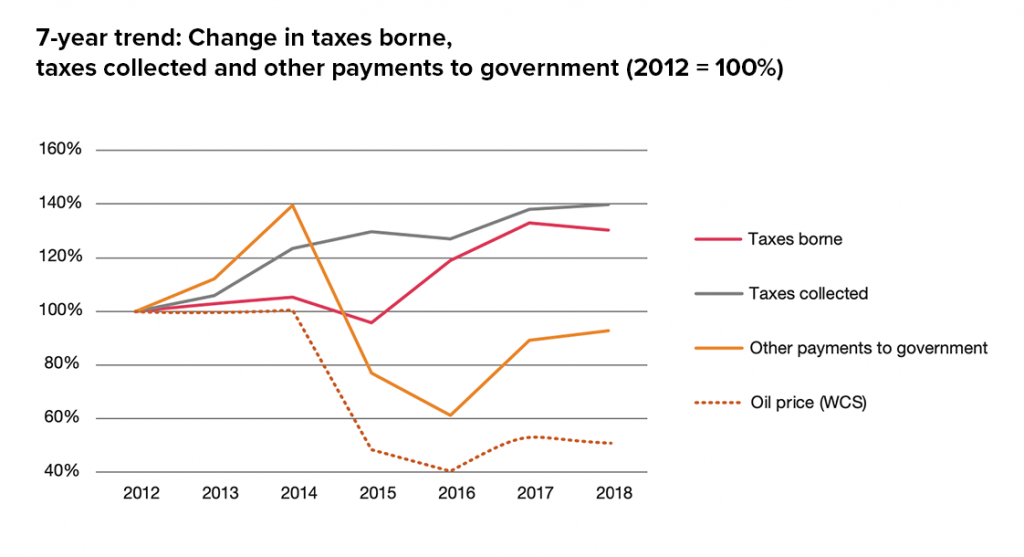
Oil price source: https://economicdashboard.alberta.ca/OilPrice
The charts show the trends for the 30 companies that provided data for each survey from 2012 and 2018, taking 2012 as the base year. Please note that the different TTC elements are not equal proportions. In 2018 taxes borne are 40% of the total, taxes collected are 54% and other payments to government account for 6% of the total contribution.
Related
Sixth Annual Total Tax Contribution Survey
May 8, 2019
Fifth Annual Total Tax Contribution Survey
May 14, 2018
About
About the Total Tax Contribution
The Total Tax Contribution methodology identifies taxes borne and taxes collected. Taxes borne by a company are a cost to the company and reflected in its financial results, e.g. federal and provincial corporate income (profit) tax and irrecoverable sales taxes.
Taxes collected are those generated by a company’s operations, but which do not affect its results, e.g. payroll taxes withheld from employees and remitted and GST/HST collected from customers and remitted.
We identified 68 business taxes and other payments to governments in this survey under the Total Tax Contribution methodology. Taxes are categorised into five tax bases, i.e. profit taxes, production taxes, employment taxes, property taxes and environmental taxes.
About the Business Council of Canada
Founded in 1976, the Business Council of Canada is a not-for-profit, non-partisan organisation representing business leaders in every region and sector of the country. The Council’s member companies employ 1.7 million Canadians, contribute the largest share of federal corporate taxes, and are responsible for most of Canada’s exports, corporate philanthropy, and private-sector investments in research and development. Through supply chain partnerships, service contracts and mentoring programs, Business Council members support many hundreds of thousands of small businesses and entrepreneurs in communities of all sizes, in every part of Canada. Please connect with us on LinkedIn or Twitter and subscribe to our podcast, Speaking of Business.
About PwC
In Canada, PwC has more than 7,850 partners and staff in locations from coast to coast.
With more than 110 years of excellence in Canada, we provide industry focused professional services including audit and assurance, risk assurance, tax, deals and consulting in areas such as cybersecurity and privacy, human resources, digital transformation and forensics. We help resolve complex issues and identify opportunities for public, private and government clients.
As part of a global network of over 276,000 people in 157 countries, we help organizations and individuals create the impact they’re looking for, by delivering the best of our collective thinking, experience and solutions to build public trust and enhance value for our people, clients and communities.
Find out more by visiting us at www.pwc.com/ca.