


Freeing trade: why a unilateral approach makes sense for Canada

Executive Summary
For the past decade, Canada has been steadily consolidating its international trade policy. Canada has aggressively pursued trade agreements with countries around the world and, once agreements with the European Union and the member countries of the Trans-Pacific Partnership (TPP) are in force, Canada’s network of free trade agreements (FTAs) will be one of the most comprehensive in the world. If the federal government moves forward on negotiations with China, Canada would have free trade with its top 13 bilateral merchandise goods trading partners, a significant accomplishment.
This begs the question – what is next for Canadian trade policy?
Negotiating increasingly complex trade agreements is exhausting and expensive: the CanadaEuropean Union Comprehensive Economic and Trade Agreement (CETA) took nearly seven years to conclude and still awaits implementation. Years of negotiations – including consultations, legal scrubs, translation and implementation plans – requires significant resources.
Now that Canada has successfully completed agreements with major trading partners, the pool of potential future partners has shrunk to smaller economies. Meanwhile, individual trade agreements can result in sub-optimal policy choices, especially as Canada continues to defend protected industries while introducing distortions through trade preferences.
Once negotiations with major economies are concluded, Canada will see limited gains from continuing to strike deals while the cost of conducting and enforcing agreements will creep upwards.
A new vision for Canadian trade policy – tabula rasa
Basic economic trade policy is premised on the understanding that a tariff on imports is equivalent to a tax on exports. Unilateral free trade – dismantling all barriers to trade without asking foreign governments to do the same – effectively removes this tax on exports.
Removing tariffs on goods entering the country lowers the cost of production inputs, increases the competitive pressure on Canadian producers and expands the number of Canadian firms participating in international trade. This increased integration within the global economy also boosts productivity through the knowledge gained from interaction with foreign clients and suppliers.
This study explores a world in which all of Canada’s trade policy counters are reset to zero. Under this tabula rasa policy, the slate of Canadian trade preferences would be wiped clean: tariff-free, preference-free, and free of administrative burdens. This unilateral free trade strategy not only removes barriers to imports, but also adopts an open policy for services and foreign direct investment (FDI).
The results are striking. The free trade version of the Canadian economy would be considerably more efficient and more prosperous than our current reality. Canadian Gross Domestic Product (GDP) would be higher in real terms by almost 1.7% and Canadian households would be better off by an amount equal to C$47 billion in income.
Further, the simulations suggest that the current tangled web of legacy protections and preferences granted under bilateral and regional trade agreements has promoted a deindustrialization of the economy. Unilateral free trade removes this unintended bias.
The major industrial sectors all make major gains in shipments. Metal products, automotive, and the chemicals/rubber/plastics sectors lead the way. Machinery and equipment, electronic equipment, transport equipment, and wood products also make sizeable gains in both exports and total shipments.
Looking to the services sector, unilateral liberalization would primarily benefit the financial services sector, though the main benefit would flow through to the industrial economy through lower cost imports.
Elimination of the complex and arbitrary investment preferences extended under Canada’s FDI policy would position the country as a destination of choice for foreign investment from all sources, helping win significant export mandates for foreign subsidiaries operating in Canada, and making Canada a preferred platform for global production.
Canada’s policy of serial preferential trade agreements is rapidly reaching its natural limits. With multilateral liberalization likely off the table for the foreseeable future following the internment of the Doha Round at the Nairobi WTO Ministerial in December 2015, the unilateral option stands out as the best way forward. Canada would remain bound by rules that it has negotiated and Canadian exporters would continue to benefit from the market opening obtained by Canada’s trade negotiators for goods, services and investment.
This study shows that adopting a policy of unilateral trade would generate significant benefits for Canada, especially if services are included. This slate can be wiped clean – and the Canadian economy would be the stronger for it.
1. Introduction
Canada is pulling out all the stops on trade policy, with major new trade initiatives at the multilateral, regional and bilateral levels, plus intensified trade promotion and international economic diplomacy efforts (Box 1). While the full effect of these initiatives has yet to be felt, Canadian export performance has remained flat since the initial rebound from the global recession of 2008-2009.
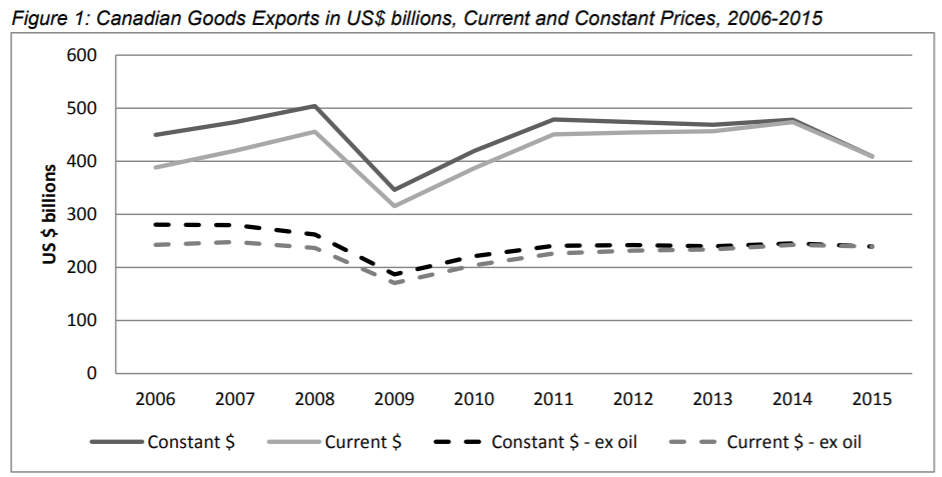
Canada’s services exports did marginally better, growing at a 1.4% in constant US$ terms since 2008. But given their relatively small scale in Canada’s trade picture, their growth does not make a significant impact on the overall trend. There are two possible explanations:
- Canada’s trade policy strategy (outlined in Box 1) is not working; or
- The headwinds facing Canadian exports, even excluding the recent declines in commodity prices, have been stronger than efforts to generate export growth.
The headwinds have indeed been strong. First, the global economy’s tepid recovery from the 2008-2009 recession has left it mired in stag-deflation. Japan’s announcement in January 2016 that it was adopting negative nominal interest rates, the European Central Bank’s cut of its refinancing rate to zero in March 2016, and the Bank of Canada’s out-loud musing about the possibility of negative nominal interest rates all tell us that, understood in conventional terms, most of the G7 is still going south – and not for a winter holiday.
Box 1: Canada’s Multi-pronged Trade Policy Strategy – Boxed-In
At the multilateral level, Canada has signed (although it has not yet ratified) the 2013 World Trade Organization (WTO) Trade Facilitation Agreement (TFA) and the 2014 WTO Government Procurement Agreement (GPA). Canada is also engaged in the Trade In Services Agreement (TiSA) negotiations that are being held in Geneva; this negotiation has the eventual goal of becoming a WTO plurilateral agreement.
At the bilateral/regional level, Canada has brought into force seven FTAs since 20091 and concluded negotiation on three others, including the second largest bilateral agreement that it has ever signed, the Comprehensive Economic and Trade Agreement (CETA) with the European Union, and the largest regional trade agreement it has ever signed, the TPP with 11 parties circling the Pacific Rim. Canada has several other negotiations underway, including with India and the Caribbean community.
Furthermore, interest in an FTA with China has been expressed at the highest levels in both countries. The pace of signing new foreign investment protection agreements (FIPAs) has been even faster with some 11 entering into force since 2009, including the high-profile agreement with China that came into force in 2014 and 7 others signed since March 2014. Canada’s Global Commerce Strategy, rebranded as the Global Markets Action Plan, targets priority markets for trade and investment promotion, pulling together the combined resources of the Trade Commissioner Service, the Export Development Corporation, the Canadian Commercial Corporation, and the Business Development Corporation. Trade promotion resources have been expanded, increasing Canada’s global footprint in terms of trade commissioners posted in consulates and embassies abroad.
High-level visits and trade promotion missions (22 at the federal level alone since 2009, most to multiple destinations) complement on-going trade promotion work by opening doors for Canadian business, familiarizing them with Canadian services abroad and serving as training grounds for these businesses in exporting.
Canada also has an active agenda of trade-facilitating initiatives, including improved border arrangements with the United States and through the World Customs Organization; agreements on double taxation, science and technology, air transport, nuclear co-operation (which enabled a sale of uranium to China), mutual recognition, and visas; and strategic dialogues
Second, the formation of global value chains has slowed. Prior to the global recession, trade grew substantially faster than global GDP, reflecting a strong dynamic of increased trade in intermediate inputs, which was in turn driven by the formation of global value chains. Since the global recession, supply chain consolidation has been in vogue, as the risks embedded in extended supply chains have made themselves felt. Border thickening due to security concerns has also undoubtedly been a factor.
Third, preferential trade liberalization is a competitive game and Canada has generally found itself in a catch-up position, trying to claw back eroded preferences. In the key NAFTA market, new FTAs entered into by the United States and Mexico (which will include the TPP) continually erode Canada’s trade preferences in the key North American market.
What’s left inside the box?
The WTO remains the cornerstone of the global trading system; but, moving forward, it must be seen as primarily providing established infrastructure for trade. The Doha Development Agenda, the first round of multilateral trade negotiations under the aegis of the WTO, effectively expired at the WTO Ministerial Conference in Nairobi in December 2015. While Ministers reaffirmed the centrality of the WTO to trade negotiations and global trade rule-making, the communiqué had the following telling statement:
“We recognize that many Members reaffirm the Doha Development Agenda, and the Declarations and Decisions adopted at Doha and at the Ministerial Conferences held since then, and reaffirm their full commitment to conclude the DDA on that basis. Other Members do not reaffirm the Doha mandates, as they believe new approaches are necessary to achieve meaningful outcomes in multilateral negotiations. Members have different views on how to address the negotiations.”
Such ruptures are usually papered over in Ministerial Declarations with “constructive ambiguity”. This was not the case at Nairobi, which means the multilateral option for liberalization is off the table for the foreseeable future.
Canada should move quickly to ratify the WTO TFA since it commits other parties to implementing modern border practices that Canada already employs. This should work to reduce trade costs for Canadian exporters – or at least to counter the general border thickening trend from enhanced border security measures.
The TiSA negotiations are an unknown quantity in terms of global trade potential. Estimates suggest that non-tariff barriers (NTBs) to services trade are high. However, if the TPP is any indication, the TiSA will have limited traction in reducing them. From a Canadian perspective, the TiSA plays to the strength of the European Union and the United States, not to Canada’s.
On the regional front, the major events in trade contain negatives for Canada. The Transatlantic Trade and Investment Partnership (TTIP) between the United States and the European Union will erode preferences that Canada enjoys under NAFTA and will shortly enjoy under CETA; the harmonization agenda between the European Union and the United States might reduce trade costs for Canada, but it will similarly do so for other third parties.
Similarly, Canada stands to be side-swiped by the Regional Comprehensive Economic Partnership Agreement (RCEP) linking the 10 members of the Association of Southeast Asian Nations (ASEAN) and its bilateral partners (Australia, China, India, Japan, Korea, and New Zealand). Securing an FTA with China would go a long way to mitigating the negative impacts of RCEP on Canada. This should also be an important element of Canada’s inside-the-box response to the changing global environment. Agreements with ASEAN and with India would round out the response to RCEP.
Bilateral trade agreements are problematic in that the rules of origin (ROOs) are tailored to each agreement. Firms that source internationally to gain a competitive advantage and align their sourcing to meet the ROOs for one agreement might not meet them for the ensuing agreements – there is thus a limitation to the effectiveness of serial bilateral agreements. From this perspective, obtaining cross-cumulation under TTIP ROOs would be a major imperative for Canadian trade policy going forward to enable Canadian traders that source inputs from either party (European Union or United States) to have those inputs qualify for “originating” status when embedded in products sold to the other. Similarly, if Canada is able to round out its agreements with Asian economies, accession to the RCEP would also facilitate use of the bilateral preferences due to the regionalization of ROOs that RCEP would provide.
This is clearly a long and difficult agenda of negotiations. The complications and administrative costs of utilizing preferences, especially between countries with language barriers and complex supply chain logistics, can raise the cost of ROO compliance. The available data suggests that preference utilization in Asia-Pacific FTAs tends to be relatively low. Canada’s trade policy and negotiation challenges here include:
- Competition for scarce budget resources
- Branding and other general marketing of Canada abroad; and
- The nature of trade promotion as time- and labour-intensive work, with relationships built often one company, one market and one product at a time.
There is some potential to boost Canadian exports through traditional mechanisms, but what’s in the box does appear to be boxed-in.
The unilateral option
Canada’s trade policy has not only focussed on exports: important steps were taken in Budget 2010 to eliminate tariffs on imported production inputs. The realization that competitiveness depends on having access to low-cost inputs has led many countries to slash import tariffs in order to enhance their own competitiveness. Indeed, the move to unilaterally remove tariffs has been the single greatest source of global trade liberalization since the 1980s (Hoekman et al., 2006).
To briefly explain how unilateral liberalization can boost exports, we return to the fundamental economic principle that a tariff on imports is equivalent to a tax on exports. While removal of a tax on imports boosts imports in the first instance, a range of effects percolate through the economy to boost exports. These include:
- The lowering of the cost of production inputs;
- The competitive pressure of new import entry on Canadian producers;
- The expansion of the number of Canadian firms participating in international trade either as exporters or as importers of intermediate goods and services (or both); and
- Exchange rate adjustments, which also work to restore trade equilibrium.
The concept of “unilateral free trade” – unilaterally dismantling all barriers to trade without seeking reciprocal action on the part of foreign governments – takes this concept to the limit. This is not new: Hong Kong has long functioned as a free port and Singapore’s tariff is effectively zero across the board. These two city-states are ranked best in the world by the World Bank at facilitating trade and both perform exceedingly well in global economic rankings.
The scope to adopt unilateral liberalization in a Canadian context, and the benefits of doing so, were explored by Ciuriak and Xiao (2014) in a study for the Business Council of Canada, then the Canadian Council of Chief Executives. The study found that eliminating all tariffs would cost the federal government roughly C$4 billion a year in revenue. Offsetting that, there would be some savings for government on the C$75 million currently budgeted for collection of border taxes and FTA management (as well as saving on teams sent to lengthily negotiate future FTAs). More importantly, the study concluded that Canada would make output gains on the order of 1% of GDP – this is approximately C$20 billion a year, based on Canada’s 2015 GDP. These gains compared well with estimates of gains under various agreements then under negotiation, including the TPP and CETA.
To a significant degree, the gains came not only from tariff removal, but also from the lapsing of the burdens of meeting Canada’s ROOs requirements under its existing FTAs. This amplified the liberalizing impact since it applied to Canada’s largest trading arrangements, namely those with the United States and Mexico under NAFTA. Unilateral liberalization was accordingly a partial re-doing of NAFTA.
Motivation for the present study
A limitation of the 2014 study was that it was conducted in a static context and did not take into account the potentially galvanizing impact of a unilateral free trade policy on business dynamics – including on foreign direct investment (FDI) which might be motivated by the increased attraction that Canada would have to globally-mobile industrial capital. Even though there has been significant movement in the direction of unilateral tariff reduction – consider, for example, Shanghai’s expanding free trade zone – Canada would stand to capture some “first mover” advantages from a fully-committed adoption of such a policy with the intent of becoming a global production hub.
The trade policy context has also changed. The Canada-Korea FTA has now been implemented and both the CETA and TPP have been signed and are now awaiting Parliament’s ratification. Accordingly, the additional gains from unilateral liberalization have been shaved in terms of tariff reduction; however, the cost savings on accessing the preferences under those agreements would now come into play. Further, Canada removed preferences under its General Preferential Tariff (GPT) for 72 more advanced developing countries, 6 which raised the potential gains from
unilateral liberalization.
The present study builds on and updates the 2014 study by re-simulating a Canadian policy of unilateral liberalization using a dynamic model that incorporates FDI, on an updated dataset, and an updated trade policy context that takes into account the new FTAs that Canada has negotiated and the increase in GPT for developing countries. In addition to tariff elimination, it also includes liberalization of services and investment policy designed to improve Canada’s attractiveness as a global production hub. This policy package is available to Canada now and does not depend on further developments on the FTA front. Future FTAs, such as Canada-China and/or the Trade in Services Agreement (TiSA), would take some liberalization potential off the table. However, for current policy purposes, these remain speculative and are not included.
The remainder of the study is organized as follows. Section 2 describes the modelling framework used for the present analysis in non-technical terms and a description of the policy shock that captures the effect of unilateral liberalization. Section 3 sets out the results. Section 4 provides a discussion and draws policy conclusions. Appendix 1 and 2 elaborate on the technical framework and the calculation of the policy shocks.
2. Modeling Unilateral Liberalization
The standard tool to analyze complex trade policies is a multi-sector, multi-region computable general equilibrium (CGE) model. We employ a dynamic version of the widely used Global Trade Analysis Project (GTAP) model modified to directly represent foreign-owned firms in each services sector of the economy to capture the impact on services trade conducted through foreign affiliates. The dataset is based on the recently updated GTAP Version 9 dataset, with a base year of 2011.
Applied to the issue of unilateral liberalization, the model allows us to take into account tariff reductions and the trade cost reductions due to the elimination of ROO compliance costs. The trade impacts from these simulations capture the linkages across sectors through national input-output tables (i.e., an increase in demand for automobiles drives fixed production requirements of steel, which in turn are met by a combination of domestic and imported steel). In addition to trade impacts, the model generates estimates for the standard national economic accounts including
GDP and it components and for demand for labour and capital.
To simulate the impact of unilateral liberalization, we establish a baseline projection to 2035, drawing on available long-term economic projections for guidance. Policy shocks are then implemented to capture the effect of the major trade agreements that Canada has negotiated and the increase in the GPT for those developing countries listed previously. The model is simulated forward in a dynamic process, whereby changes generated by these agreements in the rate of return (ROR) on capital induce investment and changes in wage rates induce increased labour force participation. This revised baseline depicts the Canadian and global economy as it would be with the aforementioned trade agreements in place.
Unilateral liberalization is then implemented as a separate policy shock. To simplify the exposition, we implement the unilateral policy in 2018, which we assume to be the year in which the TPP enters into force. Unilateral liberalization, as we model it, can thus be characterized as a policy that caps the FTA program that Canada already has in the pipeline and shows the net
additional gain that is available to Canada from this approach after the impacts of the FTA program have been realized. The impacts in 2035 may be interpreted as the permanent change in the level of economic output, once full equilibrium has been restored following the policy shocks, including the reallocation of capital and labour across sectors in response to the changed opportunities in the liberalized economy, relative to the economy as it would have been in the baseline.
We assume that a policy of unilateral free trade for Canada would be based on enhancing Canada’s position in the global economy as a production platform; accordingly, we complement the tariff elimination with a set of services market liberalizing measures aimed at enhancing the value of FDI locating in Canada to serve Canada’s new FTA partners, Canada’s traditional FTA partners, and, indeed, the world.
The tariff shock
Under unilateral liberalization, we eliminate the residual protection that Canada has facing the world, as documented in the GTAP V9 database, but only following the adjustments for Canada’s FTA program and the GPT changes.
The supply-managed sectors pose special problems because of the high level of initial protection. Solving the supply management issue is beyond the scope of the present undertaking. However, countries similar to Canada – most notably Australia and New Zealand – have transited from supply management to export-oriented industrial structures and a number of proposals have been put forward suggesting ways in which Canada could accomplish the same. We assume it is economically and politically manageable, but would require a gradual phase-out. Thus, whereas for all other sectors we assume immediate tariff elimination in order to underpin the claim for an “announcement effect” that would impact on business decision-making, we provide for a 10-year phase-out of the Canadian supply-managed tariff protection.
As an important corollary, we assume that the policy change on supply management would also remove restraints on Canada’s dairy products exports to the United States. Canada obtained significant on-paper concessions on these that cannot be used while Canada remains constrained by the classification of its dairy exports as “subsidized” pursuant to WTO dispute settlement findings. The US concessions are, on paper, even more generous than those that Canada provides the United States.8 Under a supply management reform consistent with a unilateral free trade policy, the constraint on accessing this new market opportunity would be removed. Accordingly, while the TPP scenario that applies in the baseline zeros-out US liberalization vis-à-vis Canada in dairy, under the unilateral liberalization scenario, the US tariff eliminations under the TPP would bite and generate dairy sector exports.
The ROOs shock
A number of empirical investigations into the benefits of preferential trade have concluded that the plausible range for ROO costs is 1% to 7% – this takes into account both the administrative costs of compliance and the costs of sourcing from higher-cost suppliers to meet regional value content requirements. A number of studies have concluded that, for tariffs below 5%, the costs of compliance (including time, out-of-pocket costs, and the more general hassle factor) are sufficient to compromise the value of preferences.
For Canada’s FTA partners, and the remaining GPT beneficiaries, we make the simplifying assumption that 25% of Canada’s imports from these partners utilize preferences. We further assume that the welfare cost of using preferences is equal to the mid-point of the established range, or 4%. This implies a 1% cost reduction for accessing Canada’s market for these major FTA partners, including GPT beneficiaries.
The services shock
Canada provides a comparatively liberal market access regime for services and provides little in the way of liberalization under even progressive FTAs, such as the CETA or TPP. However, in particular areas, countries with comparable social and political structures are more liberal. For the purposes of this exercise, we compare Canada’s ranking under the OECD’s Services Trade Restrictiveness Index (STRI) (Geloso Grosso et al., 2015) to those of Australia, New Zealand, and the United Kingdom. We assume that Canada adopts the least restrictive policy amongst these four countries (Canada included) for cross-border services provisions and for commercial presence provisions.
The degree of liberalization takes into account Canada’s commitments under the TPP (which cover the NAFTA and other economies in the Americas), CETA, and the Canada-Korea FTA.
Further, we assume that Canada goes one step further and not only adopts these policies on an applied basis, but also binds them under its GATS commitments – in effect, jumping the gun on the TiSA negotiations with an offer that is likely beyond what Canada has currently tabled. Such unilateral binding would provide the “kicker” to the reforms, signalling that Canada is committed to its reforms by squeezing the “water” out of its GATS bindings, as quantified under the GATS Trade Restrictiveness Index (GTRI) developed by Miroudot and Pertel (2015), and/or its bilateral FTAs, such as the CETA and TPP.
The STRI/GTRI combines the various regulatory measures that restrict services market access in one composite index of restrictiveness. The scores on these indexes take values between zero and one, where one represents a totally closed (unbound) sector and zero a fully open (bound) sector.
We create a template based on the most liberal conditions provided by Australia, Canada, New Zealand, and the United Kingdom. We compare these scores to Canada’s actual scores and calculate the implied percentage reduction in the STRI and GTRI, respectively.
This methodology covers both horizontal and sector-specific commitments. The horizontal commitments stipulate conditions and restrictions that apply to all sectors of the economy. These measures include investment screening, limitations on board members and managers of firms, impediments on acquiring land and real estate, and so forth.
The specific commitments apply to a specific sector, as indicated in the schedule. For instance, interest rate regulations pertain only to financial services. Some restrictions tend to impact some sectors more than others; for example, restrictions in public procurement have a particularly large impact on the construction sector in light of the importance of government demand for these services.
To implement the unilateral liberalization policy shock for services, we proceed as follows:
- We assume that measures of the height of Canada’s NTBs in ad valorem equivalent (AVE) terms implicitly reflect both the effect of actual restrictions and of “water”, as measured by the difference between the GTRI and the STRI (that is, the difference between bound commitments and applied practice).
- On the basis of a regression analysis of the effect of bindings (Ciuriak and Lysenko, 2016), we assume that actual market restrictions, as measured by the STRI, have twice the restrictive power as an equivalent amount of “water”.
- Accordingly, we adopt the following simple formula: Total NTB = α(STRI + 0.5*Water), where α is a coefficient that scales the change in the STRI/GTRI-based calculation to measures of the AVE of Canada’s sector-specific NTBs developed for the World Bank by Jafari and Tarr (2014).
- The percentage reduction in the STRI and the GTRI for Canada from moving to the least restrictive posture currently practiced by the four countries mentioned then generates the effective liberalization shock.
The FDI shock
For FDI, we proceed analogously to the method used for determining the services shock. In this case, we apply the method to an index of FDI restrictiveness based on the OECD’s FDI Restrictiveness (FDIR) index for Canada. In the case of FDI, we do not include a binding effect. Given Canada’s pre-existing bilateral investment agreements, the marginal impact of new bindings attributable to a policy of unilateral liberalization is not likely to be of major significance. The FDI impacts would thus come from the additional liberalization under services market access and the growth impact of the combined package.
3. Results
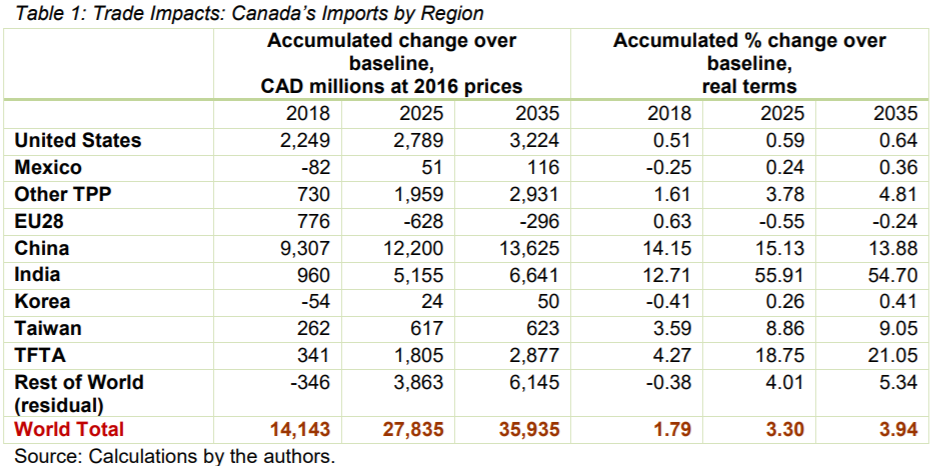
Tables 1 and 2 set out the trade impacts of the unilateral liberalization package by region. As can be seen, a policy of dismantling a country’s own trade barriers leads, in a general equilibrium setting, to a rise in exports commensurate with the rise in imports.
The main beneficiaries of the C$36 billion in additional exports to Canada would be China and India, with the United States and the other TPP parties also benefiting from reduced trade costs in Canada over and above what Canada conceded in the TPP. The bonus would also be spread worldwide, with only the European Union experiencing a small negative impact through the erosion of the CETA preferences, which are reflected in the baseline.
The main region where Canada would make export gains would be the United States. This is intuitively plausible: a policy of unilateral liberalization, once equilibrium has been restored creates a lower-cost economy that is more competitive. Canada’s main export market is the United States. Unilateral liberalization gives Canada a leg up in that key market. However, as with imports, Canada’s export gains would come from global markets in general, reflecting the non-discriminatory nature of the new policy setting and the dismantling of trade-distorting preferences.
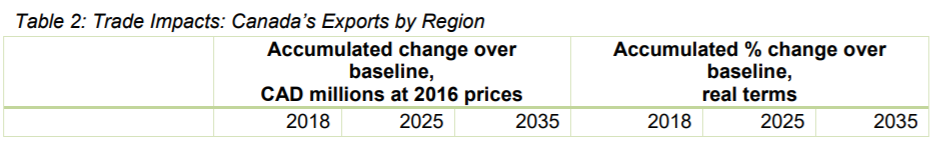
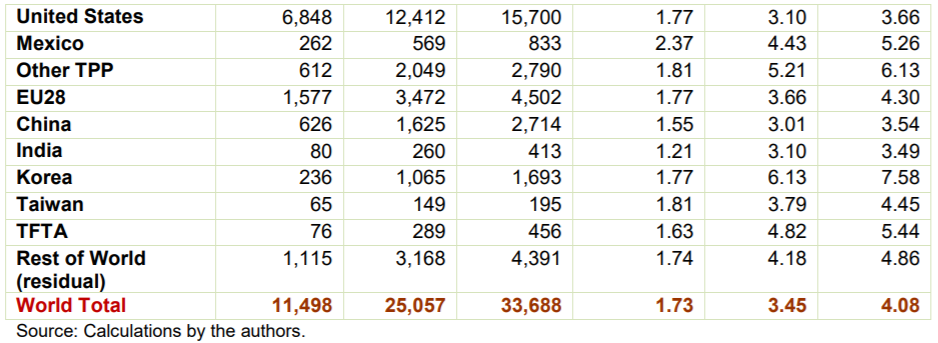
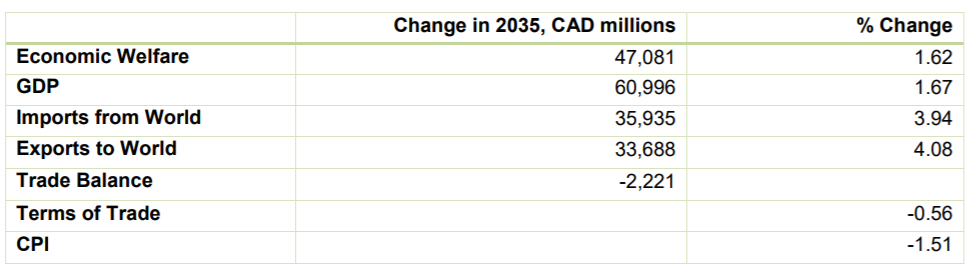
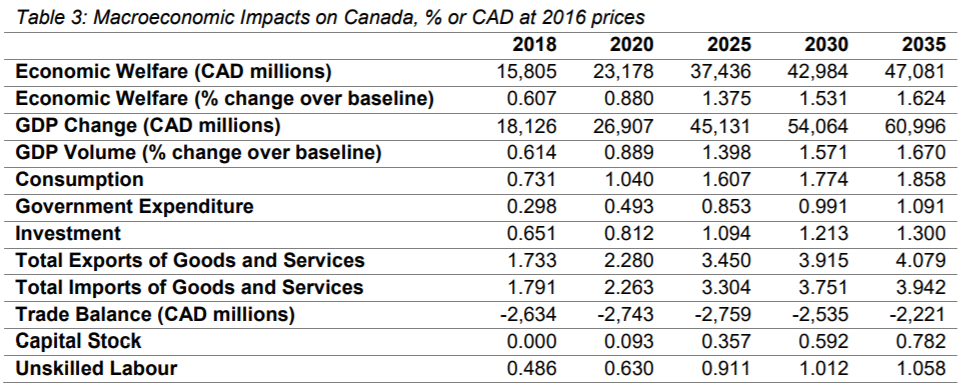
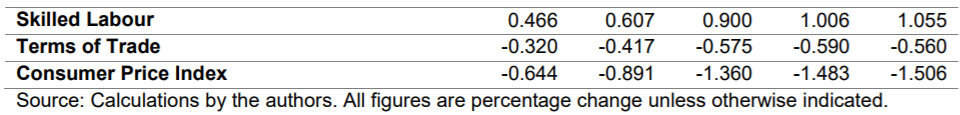
Table 3 sets out the macroeconomic impacts of a unilateral free trade policy designed to make Canada a preferred destination as a global production platform. In current Canadian dollar terms, this policy generates about C$47 billion for Canadian households and GDP gains of C$61 billion in the fullness of time. The increase in openness of the Canadian economy is significant, as two-way trade increases by about 4%; the percentage gain in real GDP is about one-third of that, which is in a reasonable range for GDP gains leveraged by increased openness.
Note that the cost reduction not only goes into supporting Canadian exports, but also in cutting the costs of Canadian production for domestic consumption, thus expanding supply capacity throughout the economy. Further, the cost reductions increase value-added growth throughout the economy as resource utilization improves. The trade balance does decline; however, this reflects to a significant extent the increased demand in Canada for imports from increased growth and investment, which boosts capital inflows and thus expands the surplus on Canada’s capital account.
In terms of the sources of the gain, the impacts for Canada stem from tariff reductions, the lapsing of ROOs costs, and services market liberalization, where the main contribution comes from the binding of services market access.
The contribution of FDI liberalization per se is modest. This result reflects the already-highlyopen Canadian investment regime. However, the strong export response in the simulation may be interpreted as Canada receiving new export mandates for the large number of foreign subsidiaries already established in Canada.
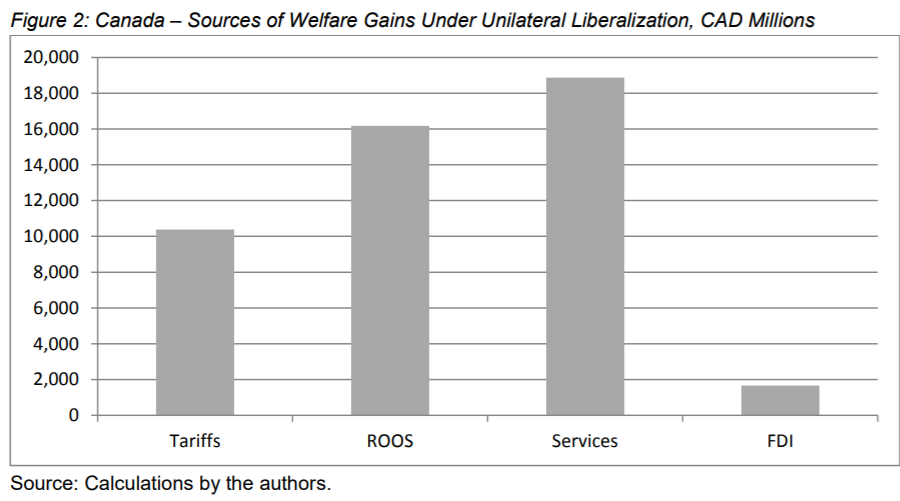
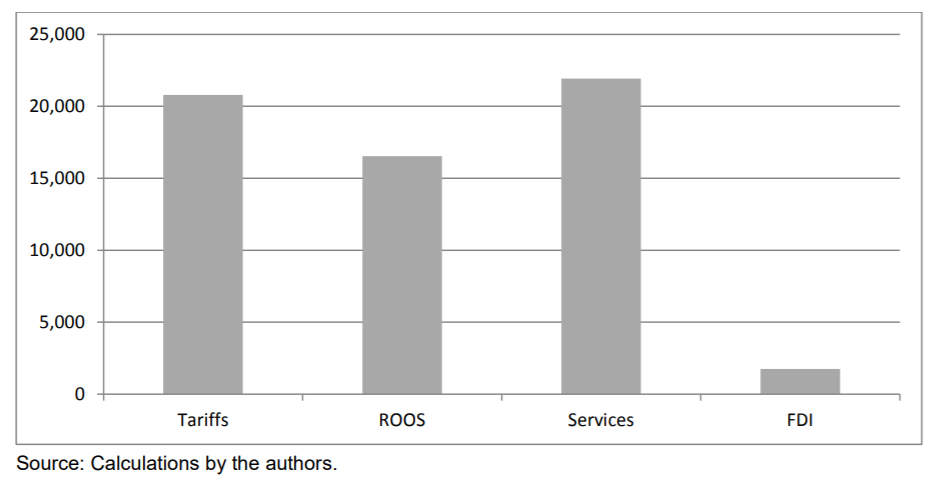
Figure 3: Canada – Sources of GDP Gains Under Unilateral Liberalization, CAD Millions
The sectoral impacts for Canada are reported in Table 4. Note that the impacts are reported in terms of the value of sales and, thus, on the same gross value basis as imports and exports. This provides an insight into the market-share impacts that industry participants will experience in terms of total shipments.
The most striking feature of this policy impact is the increase in openness of the economy: the value of domestic shipments falls, while both imports and exports rise steeply. In most sectors, both imports and exports increase. This is consistent with expectations based on modern heterogeneous firms trade theory, which predicts a reallocation of market share from lower-productivity domestically-oriented firms to higher-productivity firms that already export or that newly enter export markets as a result of the competitive effects of a liberalization policy shock.
A second striking structural feature is the general boost to industrial production over primary production. Trade policy is industrial policy – it is a choice about which products a country decides it wants to produce itself and which it prefers to purchase on global markets with the receipts earned on its exports. Unilateral liberalization effectively sets the trade policy dials back to zero – a tabula rasa. These results thus demonstrate that Canada, through its tangled web of remaining legacy protection and new preferences, has adopted a policy that creates a bias towards de-industrialization.
In the agricultural sector, predictably, the model interprets the policy shock as implying a steep reduction in dairy production. This is probably overstated, because unilateral liberalization would imply removal of the impediments to dairy exports that Canada currently confronts. We phase in the shock over ten years, a period that would allow as significant a degree of consolidation of dairy production into Canada’s most productive dairy regions as was seen over the past two decades, during which the number of Canadian dairy farms was reduced by half to about 12,500 today. A Conference Board of Canada study suggests that with some further consolidation, the Canadian dairy sector would begin to approximate the efficiency of leading dairy producers and attain export volumes half that of New Zealand’s. The export gains reflected in our simulation fall well short of that.
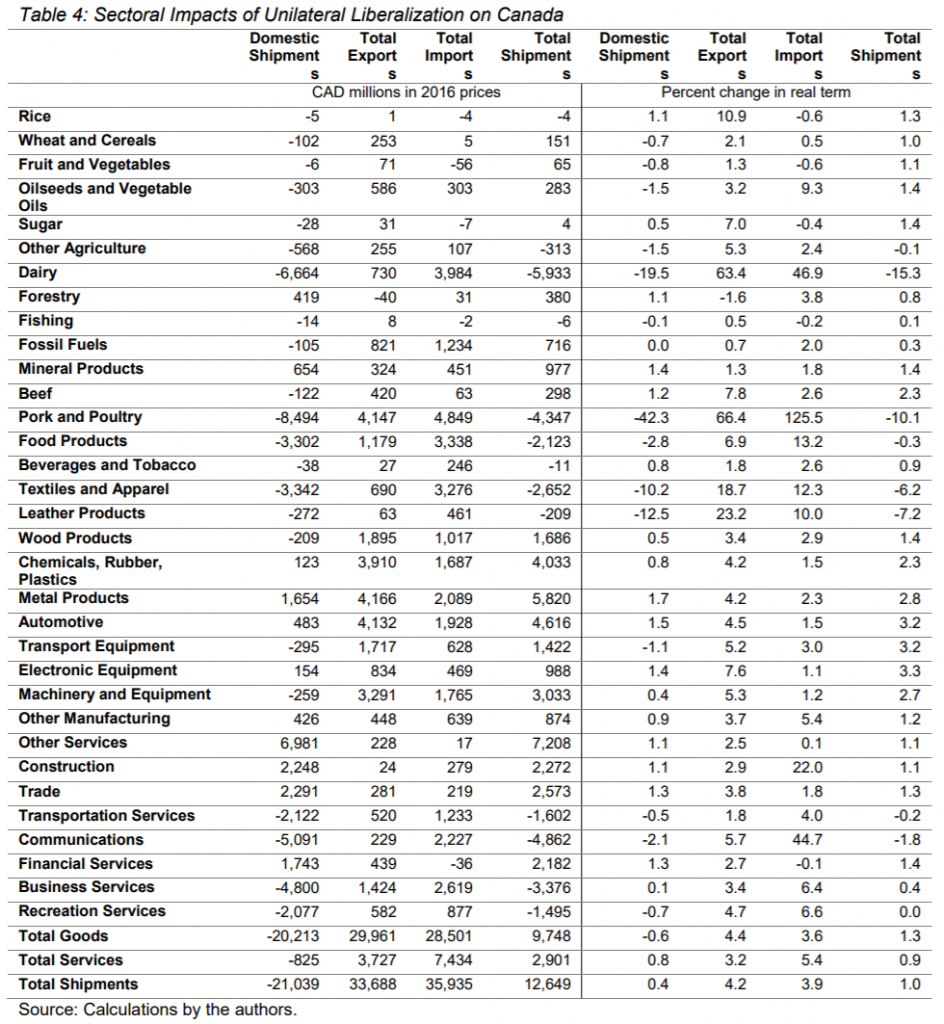
The poultry sector, similarly, would be predicted to shrink under a policy of unilateral liberalization. Again, this simplistic result does not take into account the potential for structural adjustment. Just as Canada became a quality wine producer after trade liberalization, so it could become a quality poultry producer, exploiting natural advantages in agricultural production to tap into rapidly growing markets.
Such adjustments in dairy and poultry would reduce the implied “re-industrialization” effect of unilateral liberalization, but would not likely remove it. Canada’s other primary sectors would be little affected. Unilateral liberalization thus promises these sectors neither boom nor bane. That is not surprising: basic commodities are production inputs and for the most part face low trade barriers.
Canada’s services sector would, like the goods sector, become more open, but the simulation suggest there would be less of an overall gain – the main benefits from unilateral liberalization would be the revival of industrial production in Canada.
4. Discussions and Conclusions
This study examines the implications of setting a blank slate – a tabula rasa – for Canadian trade policy, erasing the distortions that have accumulated by default or design under Canada’s trade strategy. By resetting the trade counters to zero, we create a system free of tariffs, tariff preferences, and the complex administrative burdens to access those preferences. Compared to the current tangled web of Canadian trade agreements, this modeled economy is more efficient and more prosperous than the one we have now – by a considerable amount.
The numbers illustrate the well-established theoretical proposition that reducing trade costs makes an economy more open – liberalizing imports effectively removes a tax on exports. The numbers also illustrate that a more open economy is likely to be more efficient and realize greater welfare outcomes.
For Canada, the simulations indicate that the current tangled web of legacy protection and preferences granted and received under bilateral and regional trade agreements has promoted a de-industrialization of the economy. As we have noted, trade policy is industrial policy and this is not likely an intended outcome of Canada’s overall industrial policy.
The structural adjustments the model predicts under unilateral liberalization do not take into account likely structural adjustment within the highly-protected dairy and poultry sectors and, thus, likely overstate the reduction of activity in those sectors and the re-industrializing impulse. However, on balance, a Canadian economy unencumbered by its current trade policy would experience a boost to industry. This would be a desirable outcome given what is known about the dynamic effects of industrial activity, which features positive knowledge spillovers and scalability that land-based production does not.
While we designed the policy shock to make Canada as attractive a destination for FDI as possible, the simulations suggest there would be little direct gain from such policies. This reflects the fact that Canada already is highly-open to foreign investment and indeed is one of the most heavily foreign-invested countries in the world. Our simulations suggest there is little further gain from pursuing FDI. However, the strong export response can be interpreted as Canada winning significant new export mandates for the foreign subsidiaries that are established there. This would be an important aspect of a unilateral policy aimed at making Canada a preferred platform for global production.
The services sector liberalization shock that we build in – making Canada as open to services imports as the most liberal regime per sector currently applied by the United Kingdom, Australia, New Zealand, or Canada – does not make Canada a services export powerhouse. Financial services do well, but the main benefit flows through to the industrial economy through lower cost inputs.
For services, we assume that Canada not only liberalizes on an applied basis, but also unilaterally binds this enhanced market access under its GATS commitments. Binding should reduce uncertainty and reduced uncertainty should have an impact on trade. We do not build such a binding into the tariff shock. However, we note that recent analysis suggests that “squeezing the water” out of the tariff, as we do with the services commitments, has a further powerful stimulating effect in terms of promoting goods trade.
Several caveats and cautions are in order about the present analysis.
First, this study should not be interpreted as a call for laissez faire economic policy in general. It makes the case that the current trade policy, as it stands following the negotiation of Canada’s current portfolio of FTAs (which have gained Canadian exporters preferential access in most of Canada’s major markets) is, nonetheless, a less effective policy than none at all, as defined by the tabula rasa we simulate. The study does not, however, comment on the positive agenda for industrial policy, including in such critical areas as innovation.
Second, it is silent on the path to reaching the better outcome. An analogous situation faced Canada at the time of the signing of the Canada-United States FTA. In that historical episode, Canada went through a painful initial decline before gradually recovering. Armed with an understanding of that experience, hopefully a more effective policy implementation could be crafted – especially in view of the fact that Canada would not be constrained by international commitments, but would be making choices on its own.
In terms of conclusions, we would emphasize the following main points.
Canada’s policy of serial preferential trade agreements is rapidly reaching its natural limits. Under preferential agreements, ROOs constrain firms to sourcing within a preferential zone to take advantage of that zone’s preferences. For smaller businesses, in particular, taking advantage of international sourcing to boost competitiveness, while also accessing multiple preferential agreements, may be difficult. With major trade agreements with the United States, the European Union, and the TPP Pacific partners already signed (if not all implemented), only China stands out as having the potential to generate significant additional trade.
With multilateral liberalization likely off the table for the foreseeable future following the internment of the Doha Round at the Nairobi WTO Ministerial in December 2015, the unilateral option looms large as a potential option. Building on Ciuriak and Xiao (2014), this study shows that even with the CETA and the TPP in the fold, there remains significant potential from a policy of unilateral liberalization, especially if services are included.
The slate can be wiped clean.
References
Appendix 1: Description of the model and modelling assumptions
The CGE model
To model the impact of unilateral liberalization, we use a recursive
dynamic version of the standard GTAP CGE model, adapted to incorporate FDI (Ciuriak and Xiao, 2014, provide a description of the way FDI is incorporated in the model). CGE models integrate a number of accounts to provide a complete description of an economy:
- The standard national income and expenditure accounts;
- A breakdown of industry by sector that reflects inter-sectoral input-output links, which take into account internationally-sourced intermediate goods and services (in all, the GTAP dataset allows for the representation of up to 57 sectors, 43 of which are goods);
- A production function for each sector that combines sector-specific inputs of capital, skilled and unskilled labour, and intermediate inputs; and
- A trade account that models the international linkages for each sector of the economy.
The model generates results for national account aggregates, industry output and prices, factor inputs and prices, and trade flows. For a technical description of the GTAP model, see Hertel (1997); for a discussion of the degree of confidence in CGE estimates, see Hertel et al. (2003).
On the production side, the model evaluates efficiency gains from reallocation of factors of production across sectors. In the first stage, land, labour (skilled and unskilled), and capital substitute for one another to generate domestic value-added by sector; intermediate inputs, which include imported intermediates, substitute for domestic value-added in a second stage.
Given that we use a dynamic model, both labour and capital respond to changes in factor returns. Labour responds to changes in the wage rate according to an estimated long-run elasticity equal to one. Capital supply responds to changes in the ROR on capital; the investment response is based on the Monash capital model (Dixon and Rimmer, 1998). Both labour and capital are mobile across all sectors within a country. Capital is also mobile
internationally.
On the demand side, an aggregate Cobb-Douglas utility function allocates expenditures to private consumption, government spending, and savings so as to maximize per capita aggregate utility. Following a shock, such as unilateral liberalization, the changes in consumption are allocated across these three aggregates based on their income shares in each region.
Private household demand responds to changes in prices and income. This latter effect reflects the fact that consumption of particular types of goods, such as luxury goods, increases more with higher income than does consumption of other goods, such as staple food products. Notably, changes in trade protection not only result in changes in the prices of intermediate production goods, but also in the prices of consumer goods, which induces demand responses.
The trade module assumes imperfect substitution based on product differentiation across regions. The key parameter determining the scale of impacts on trade from a tariff shock is the elasticity of substitution – a high substitution elasticity generates relatively large trade impacts for a given size of tariff shock. Note that the GTAP sectors reflect relatively large aggregates of individual products; accordingly, substitution elasticities are lower than they would be for product categories that are defined more narrowly and, thus, are more substitutable for each other.
Economic welfare is based on equivalent variation, the lump sum payment at pre-shock prices without the shock that leaves households as well off as in the post-shock economy.
We use a perfect competition specification of the GTAP model. Some models incorporate imperfect competition for industrial goods sectors, introducing price mark-ups that represent monopolistic pure profits in equilibrium. These price mark-ups are reduced by intensified competition under trade liberalization, generating additional welfare gains. 13 Several recent models incorporate heterogeneous firms features, which generate productivity gains from the reallocation of market shares to more productive firms under trade liberalization. As it is problematic to combine all these features in one model while retaining a reasonable degree of product and regional disaggregation, no single modelling exercise can be considered definitive;
a suite of studies is required to hone in on the likely impacts (see, e.g., Narayanan et al., 2015).
Implementation
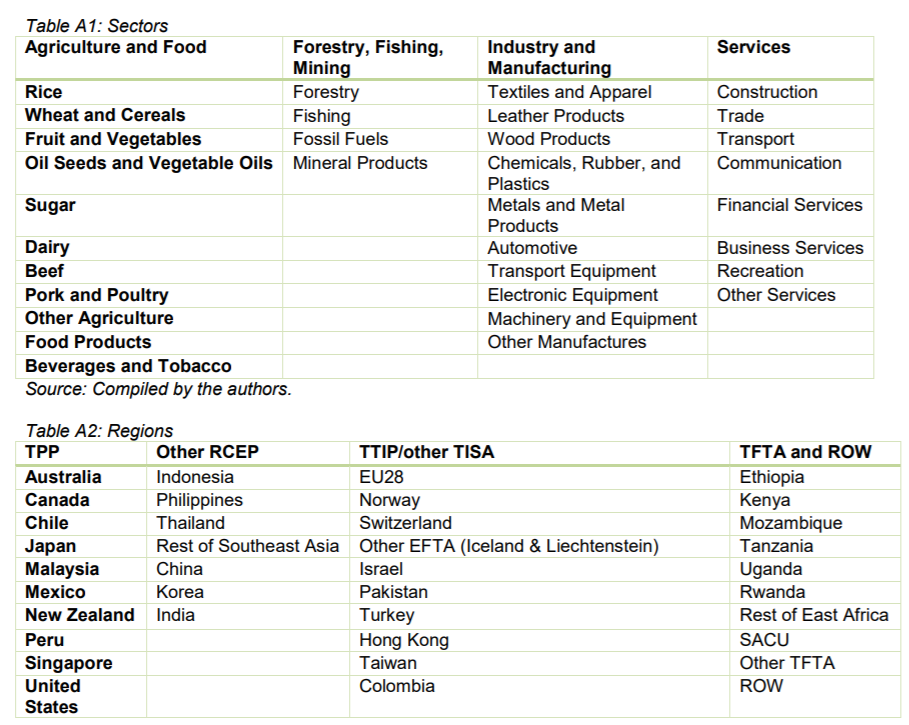
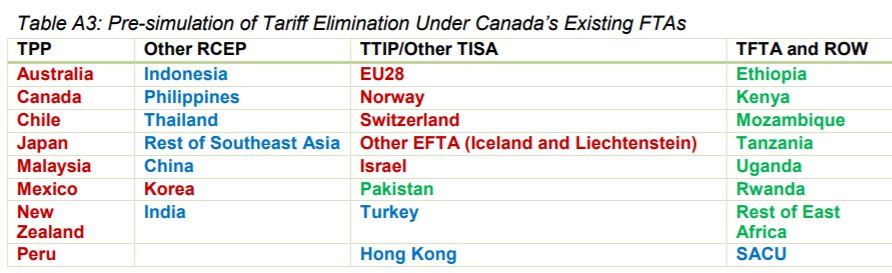
We use the recently-updated GTAP V9 database with a base year of 2011. We adopt a 33-product group aggregation (Table A1), featuring 11 agricultural and food sectors, 4 other primary sectors, 10 industrial sectors, and 8 services sector. We model 40 regions (Table A2). We first simulate the GTAP database forward to 2035, using GTAP dynamic database tools, and drawing on available data (IMF World Economic Outlook, October 2015, for the near term and projections from Fouré et al., 2012, for the out years). The policy shocks are implemented on this projected base in a dynamic process, whereby changes in the ROR on capital induce investment changes and changes in wage rates induce labour force participation changes.
The policy shocks – tariff reductions, the effect of ROOs on preference utilization, NTBs on services, and NTBs on investment – are simulated sequentially, allowing us to decompose the impacts by policy measure. The results reported are changes relative to the baseline at 2018, 2025, and 2035. The reported gains in 2035 may be interpreted as a permanent increase in the level of trade and economic output, once full equilibrium has been restored following the policy shocks, including the reallocation of capital and labour across sectors and regions in response to the changed opportunities flowing from the TPP policy shock.

Closures
In CGE simulations, the number of endogenous variables is limited; the others must be set exogenously by assumption and the modeller decides which are which, thus defining the “closure” of the model. CGE models can be simulated with various alternative closures; the choice influences the results significantly.
Under the GTAP model’s default microeconomic closure, the factor endowments (i.e., the total supply of labour, both skilled and unskilled, as well as of capital and land) are fixed; factor prices (i.e., wages and returns to capital and land) adjust to restore full employment of the factors of production in the post-shock equilibrium. Under alternative microeconomic closures that are sometimes used, the returns to capital or to labour can be fixed and the supply of capital and/or labour then adjusts to restore equilibrium. Each of these closure rules makes an extreme assumption about the supply of labour and/or capital: it is either perfectly elastic or perfectly inelastic. The reality is likely to be somewhere in between.
In the GTAP-FDI model, investment adjusts to changes in the ROR; similarly, we allow labour supply to adjust to changes in wages. As a result, unilateral liberalization generates “endowment” effects: that is, the supply of labour and capital (i.e., the initial endowments of labour and capital) changes based on changes in returns to labour and capital. For both labour and capital, the supply elasticity is set at one; for labour supply, this assumption is based on estimates of long-run labour supply from the literature; for capital supply, the assumption is based on regressions of the investment response to a change in ROR using firm-level data.
As regards the GTAP’s macroeconomic closures, two approaches are available. First, the current account can be fixed, which assumes that the external balance is determined entirely by domestic investment-savings dynamics. When trade policy shocks result in unbalanced changes in imports and exports, the original trade balance is restored by implicit exchange rate adjustments. Alternatively, the current account can be allowed to adjust to the trade shock. The change in the current account must then be offset by equivalent changes in capital flows. In reality, unbalanced trade impacts are likely to have both effects: induce subsequent exchange rate adjustments and offset capital flows. The choice of macroeconomic closure can have significant implications for the model outcomes. Given the active role of FDI in our model, we necessarily adopt the closure where the current account adjusts.
Appendix 2: Description of the policy shocks
Pre-simulations
To update the trade policy context, we first simulate the impact on Canada of the trade agreements that have been implemented or signed since 2011. Specifically:
Canada-Korea FTA: the policy shock draws on the Ciuriak et al. (2015b) study for the C.D. Howe Institute of the CKFTA as negotiated.
CETA: the policy shock draws on work being developed for a study for the C.D. Howe Institute of the CETA as negotiated.
TPP: the policy shock draws on the Ciuriak et al. (2016) study of the TPP as negotiated.
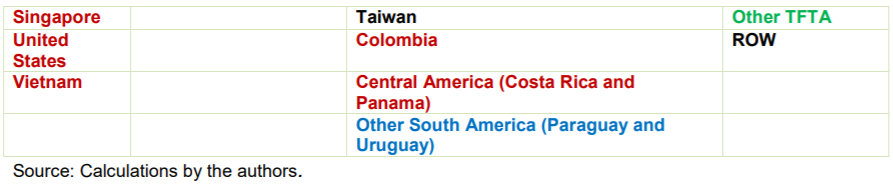
Other FTAs: we eliminate tariffs between Canada and the following regions: Colombia; “Other Central America”, which includes Panama and Costa Rica, and represents a good proxy for Panama and Honduras; and the EFTA countries (Norway, Switzerland, and Other EFTA in our regional model). These countries/regions are red-lined in Table A3.
We also raise the tariff protection in the GTAP database for major recipients of Canada’s GPT preferences, which lapsed with the GPT reform in 2015. These countries/regions are blue-lined in Table A3. The GPT tariff break of 3% applies only to about 1,000 items and, thus, does not cover all imports. We assume that 25% of the imports into Canada benefit from the GPT, which implies a 0.75% tariff increase facing the countries losing GPT preferences. We apply this increase across the board.
Within the Rest of the World (ROW) category, there are some countries that have FTAs with Canada (e.g., Jordan) and some that have lapsing GPT preferences (e.g., Russia). As any adjustments to the ROW would be minor and problematic to incorporate, we leave the GTAP trade protection facing this region in the Canadian market unchanged.
The tariff shock
The tariff shock is simple: full elimination of remaining tariff protection for all regions (including residual protection facing Canada’s FTA partners post-the-various-FTAs). The dairy, pork, and poultry tariffs are phased out in a straight line over 10 years.
The ROOs shock
The 1% ROOs shock applies to imports from the recipients of Canada’s preferences, namely the red-lined FTA partners and the green-lined GPT recipients.
The services shock
The OECD STRI project was launched by the Trade Committee in June 2007 as a tool for quantifying barriers to trade in services at the sector level (OECD, 2007). The STRI database contains information on market access, national treatment, relevant domestic regulation, and administrative procedures in all the OECD member countries and key partners (Brazil, China, India, Indonesia, Russian Federation, Colombia, Latvia, and South Africa). The database records measures applied on a most-favoured-nation basis, and does not consider preferential treatment entailed in regional trade agreements. The sources of information for the database are laws and regulations in each OECD member country.
The STRI transforms the qualitative information contained in the database into numerical values that can be used for quantitative policy analysis, including impact assessment of policy reforms. The STRI scores are broken down into five policy areas: restrictions on market entry conditions, restrictions on the movement of people, other discriminatory measures, barriers to competition, and regulatory transparency.
In order to develop a cross-border services shock, we create a sub-index of the STRI, which only takes into account the cross-border measures. We refer to this as the Cross-Border Services Restrictiveness Index (CBS-RI). Also, a similar index is developed to capture the commitments made in GATS to calculate the bound level (G-CBS-RI). The difference between CBS-RI and G-CBS-RI is called “water in the GATS”.
In order to develop the services shock, a template based on the applied and bound level of commitments is made and applied to Canada’s STRI and GTRI scores. The template is constructed based on the most liberal regime for a particular sector in Canada, the United Kingdom, New Zealand, and Australia. Table A4 shows the scores for Canada, if it adopted the most liberal framework in each sector of any of the four countries surveyed. The reported figures are based on the combined best scores across different service sectors in cross-border services:
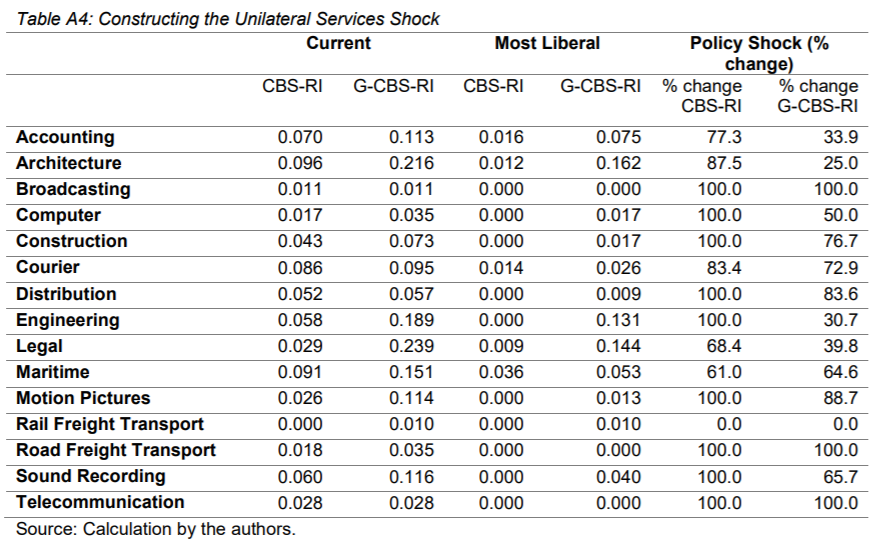
As can be seen from this table, most of Canada’s scores in cross-border services move to zero, which represents no further restrictions in the respective service sector. In other words, at least one of Canada’s peer groups – which comprise countries with highly-similar governance frameworks, levels of income, etc. – has found it feasible to adopt similarly liberal market access conditions for services. On average, Canada liberalizes the applied level (current level of practice) by 85% and improves upon its GATS bindings by 62%. In our methodology, to avoid double counting, we take into account the liberalization Canada has made that can be attributed to the previously negotiated FTAs for Canada (NAFTA, Canada-Korea FTA, CETA, and TPP), for which separate shocks were developed.
The FDI shock
A similar approach as for cross-border services is taken to construct a highly-liberal policy shock for FDI. Based on the OECD STRI and FDIR indexes, we construct a template comprised of regulatory measures affecting FDI (FDI-RI), using the weights developed by the OECD. A similar index is developed to reflect the bound level (G-CBS-RI). Table A5 shows the implications if Canada adopted the most liberal regime per sector, based on the combined best scores across different service sectors in FDIs of the four comparator countries.
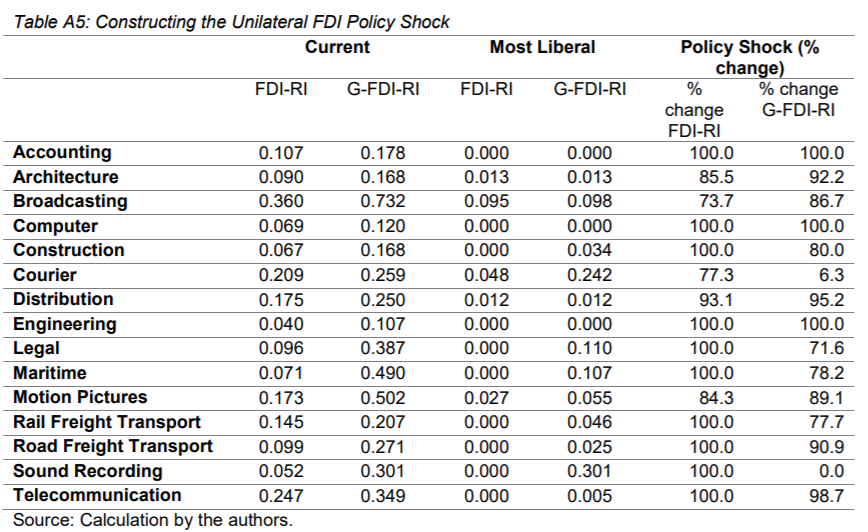
As can be seen from this table, most of Canada’s scores on FDI restrictions move to zero, which represents no further restrictions in the respective service sector. On average, Canada liberalizes the applied level (current level of practice) by 94% and improves on its GATS bindings by 77%. While these figures seem large, it must be borne in mind that that the level of restrictiveness is very low. For FDI, the liberalization amounts to elimination of nuisance tariffs and the effect is not large.
Applying the shock in the CGE model
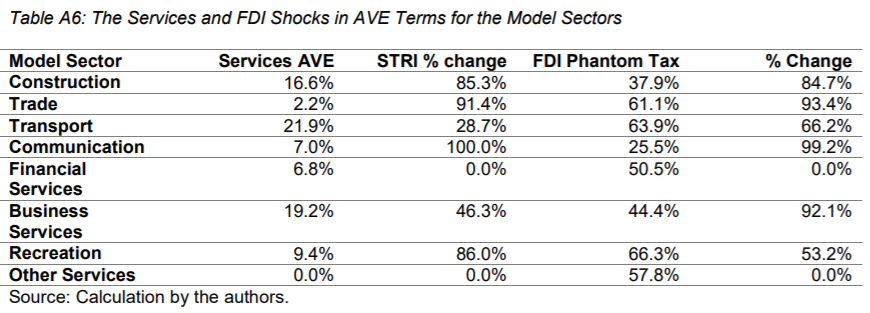
For the simulations, these sectors are aggregated to the sectors in the model. We then apply the percentage changes for the indexes as aggregated to the model sectors to estimates of the AVE levels of protection applicable in each of the model sectors.
For services we draw on estimates for such services protection from Jafari and Tarr (2014), a World Bank study that estimated these barriers for eleven services sectors in 103 countries.
For FDI, the shock is to the “phantom tax” that is part of the GTAP-FDI model database, which explains the gap in the observed ROR on domestic capital and the ROR on FDI (implicitly, this gap exists because of restrictions on FDI). This shock is then applied in the CGE model simulation.
As can be seen from Table A6, moving to a “most liberal” standard implies in some sectors a very large percentage cut in implied barriers to services trade, implying substantial reductions in the cost of services used by Canadian business across the spectrum of industries.
Implied policy changes in Canada
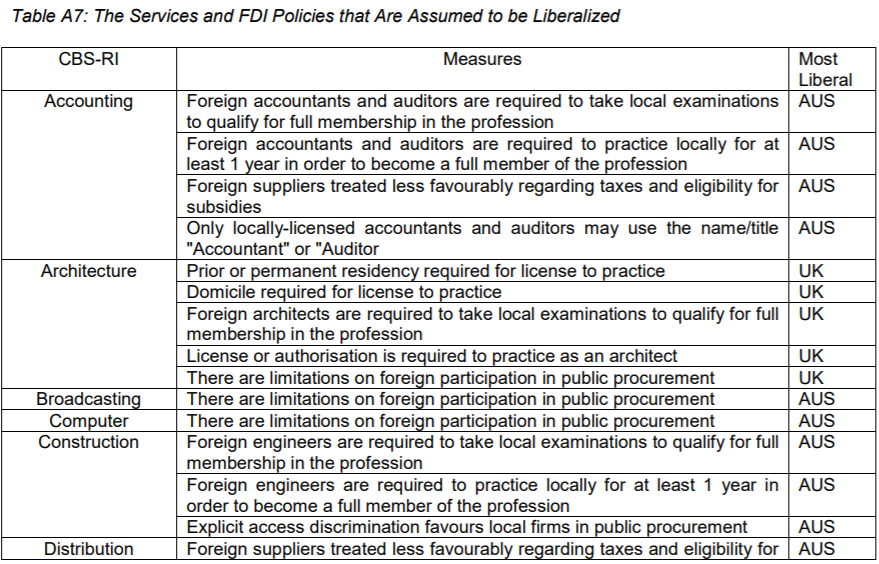
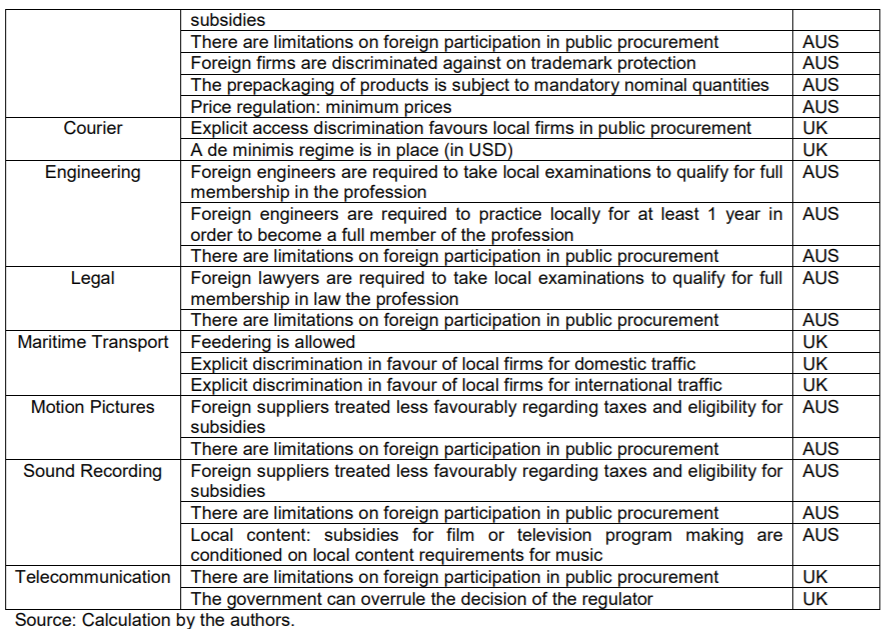
The highly-granular method applied in constructing the policy shock generates a rich information base concerning the policy measures in Canada that would have to be amended to take it to the liberal trade regime described by the policy shock. Table A7 details the various measures that would have to be amended by Canada to achieve these scores.
We identify some 38 sector-specific measures on which Canada is less open than either the United Kingdom or Australia. New Zealand did not make the cut. Of these measures 10 relate to public procurement restrictions; another 12 relate to licensing of professionals (architects, lawyers, engineers, etc.); the remaining measures cover a range of issues.