


Competitiveness Scorecard
Measuring our success on the global stage

Countries compete globally for talent, investment, and opportunity.
To understand how Canada compares and competes with its peers, Deloitte analyzed more than 500 data points across a set of 12 key countries: US, UK, Sweden, Italy, Mexico, Netherlands, South Korea, Germany, Australia, France, Spain, and Japan.
With a broad lens, Deloitte assessed competitiveness in the following eight dimensions:
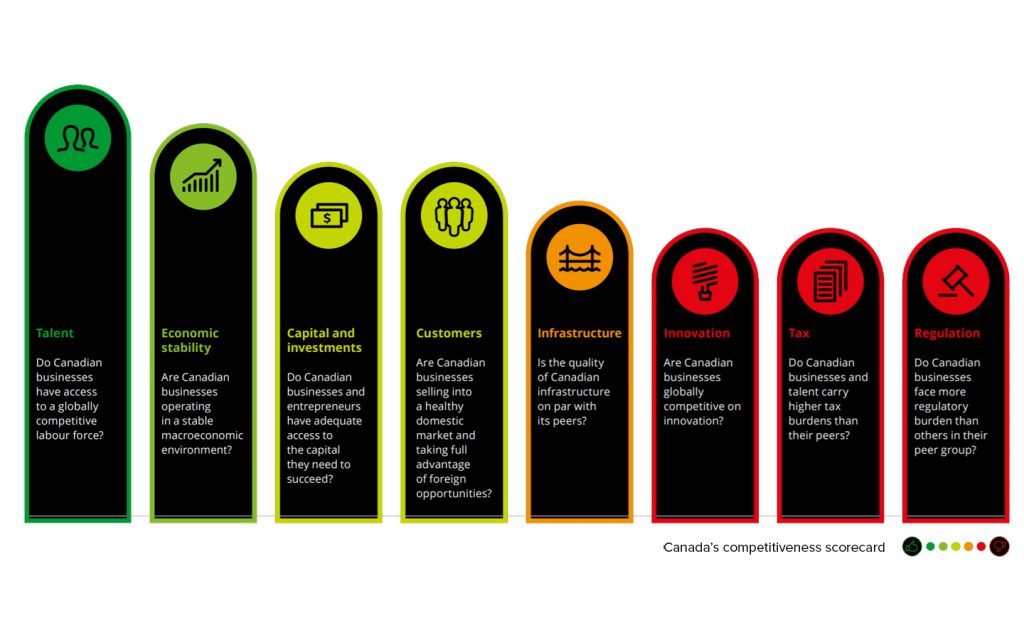
Talent
Canada’s labour force is globally competitive
Canada’s labour force is world-class, and outperforms its peers on educational attainment
Canada has a world-class, highly educated labour force that can be viewed as a key competitive advantage.
The country has a strong primary and secondary public education system. In 2015, Canadian secondary school students (those 15 years of age) in math, science, and literacy outperformed the OECD average, placing Canada among the global top 10 in the Programme for International Student Assessment (PISA).
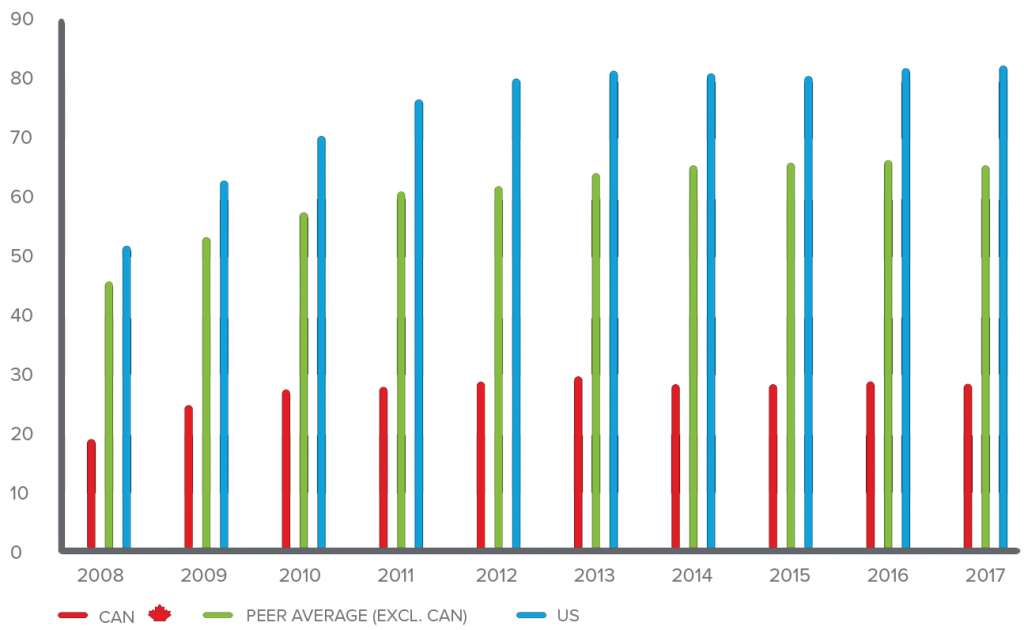
Similarly, from 2008 to 2017, Canada boasted a postsecondary educational attainment rate of over 57 percent for individuals between 25- 34 years old, higher than peers on average.
Canada also has universities in the top 40 of the QS University Rankings, placing its universities in the top 5 percent globally.
The quality of Canada’s colleges and institutions are also an important dimension of Canada’s talent competitiveness. In recent years, colleges have increased their innovation activities and experiential learning offerings—critical inputs into a globally competitive labour force.

Taken together, these findings reflect a high-quality labour force. However, Canada’s education sector faces some looming challenges that may require attention to safeguard the nation’s competitive positioning.
While Canada scores high in PISA rankings, its performance in mathematics at the secondary school level declined from 2003 to 2015. Given the projected importance of science, technology, engineering, and mathematics (STEM) fields in the coming years, this could challenge efforts to make Canada a global leader in technology-intensive fields.
Reviews have also identified a need to better align secondary and post-secondary teaching with the needs of the workforce to ensure graduates are able to meet the needs and expectations of employers, which are constantly changing due to technological advances.
These observations do not, however, diminish the overall competitiveness of Canada’s labour force. Canada produces a highly skilled pool of talent, which attracts multinationals seeking the best and brightest to invest in operations in Canada.
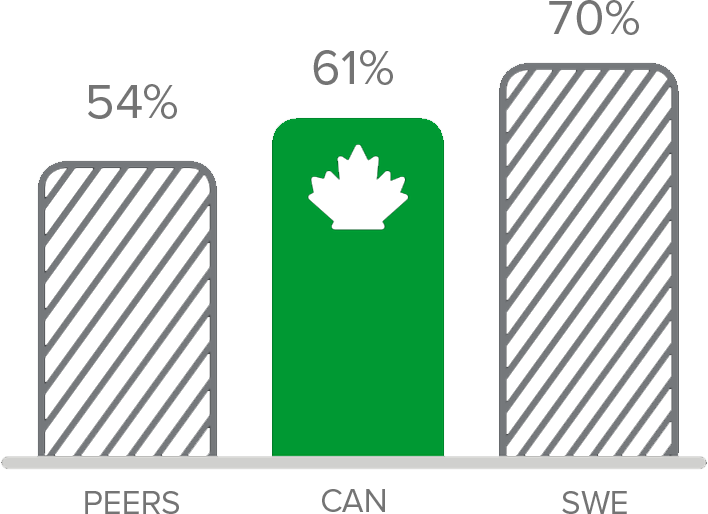
Canada has low barriers for female workers

Canada has consistently been a global leader in the participation rate of women in the labour force, suggesting that it has favourable ecosystem factors that enable women to enter the work force. In 2017, the labour force participation of women in Canada was second among peers, at nearly 61 percent—behind only Sweden, at 70 percent. On average, over the last 10 years, Canada’s rate has been approximately 10 percentage points higher than France, South Korea, and Spain.
There could be several contributing factors to this area of strength. For example, the length of employer-protected maternity leave in Canada is on par, or slightly higher than peer nations. This enables working women with children to take time away from the workforce and re-enter it without too much difficulty. Despite this high level of women in the workforce, there’s room for improvement. Analogous to its peers, Canada has made little progress in closing its gender wage gap—closing it only 1.9 percent between
2006 and 2014. In 2017, Canada’s gender wage gap was 18.2 percent. In addition, several reviews have identified a lack of gender diversity on Canadian boards as a persistent challenge in ensuring diversity at the executive level. In 2014, the Government of Canada announced a goal to increase the participation of women on boards of directors to 30 percent by 2019.
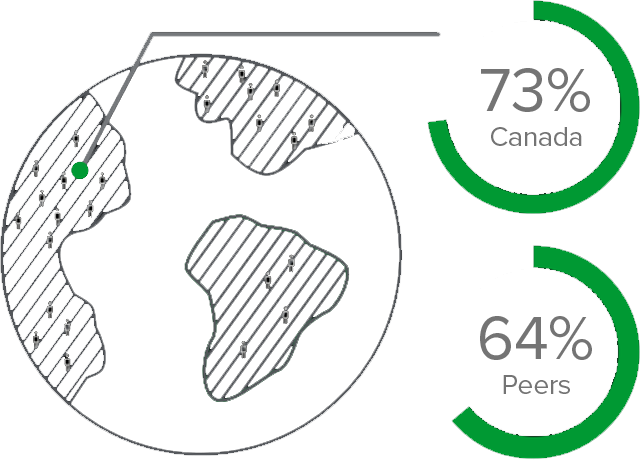
In 2017, Canada had the highest employment rate for newcomers
Successfully attracting talent from abroad is a key factor in maintaining market competitiveness for Canadian- based companies. Since 2008, Canada has consistently been in the top quartile (oscillating from first and second place) in the proportion of foreign-born workers that are employed, suggesting that Canada has been effective at ensuring immigrants are able to find employment and contribute their talents to the economy.
In 2017, Canada ranked first among its peers—with approximately 73 percent of new Canadians employed, higher than the peer average of only 64 percent.
Canada’s success can be attributed to several factors. First, its long-standing commitment to multiculturalism is an integral part of the national ethos. This commitment can be viewed as a competitive advantage in attracting global talent.

The 2018 INSEAD Global Talent Competitiveness Index found that Canada’s openness towards other cultures contributed to strong levels of talent attraction. Canada’s performance in this regard was ranked 10th in the world, higher than the United States, which ranked 18th.
Secondly, Canada’s immigration policies can set new residents up for success. The federal merit-based immigration system prioritizes individuals who have skills and backgrounds that align to the needs of the Canadian workforce—ostensibly improving their employability prospects. This is complemented by the Provincial Nominee Program, which empowers provinces to nominate individuals who could meet specific localized skills gaps.
While Canada has pronounced strength in this regard, it may not be capturing the full talents of its immigrant workforce. Canada’s overall unemployment rate is low relative to its peers, but unemployment rates among new Canadians are higher than those born in the country across similar levels of education and qualification. A recent report by the Conference Board of Canada found that a potential driver of immigrant unemployment was a lack of recognition for international credentials. If these credentials were recognized, new Canadians could earn a combined $13.4 to $17 billion more annually.
In some segments of the economy, Canada is particularly reliant on attracting talent from abroad. The Council of Canadian Academies reported that while new Canadians are a small share of the total population, they represent 50 percent of STEM degree holders—a critical input into an innovation-ready economy.
Economic Stability
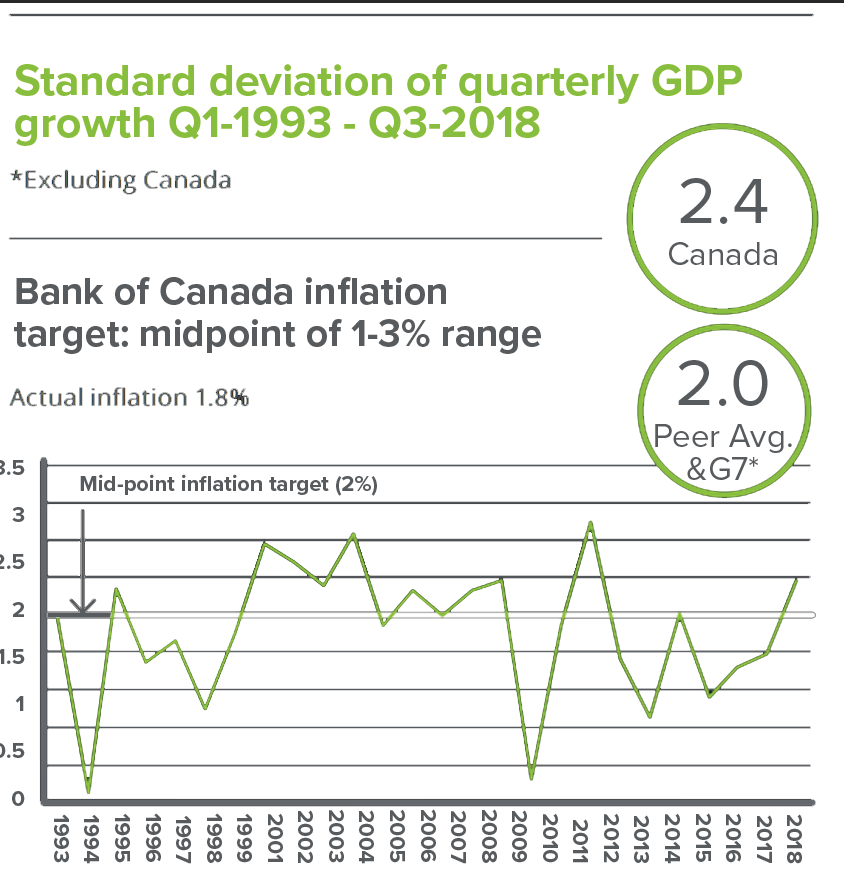
Canada’s macroeconomic stability underpins economic growth
Canada scores high on macroeconomic stability, such as the Bank of Canada’s inflation-fighting success
Economic stability is important for competitiveness because it can be a catalyst for economic growth and encourage domestic and foreign investment in Canada. It can be assessed through a number of key metrics, including the volatility in economic growth, labour market flexibility, the volatility of prices as captured in metrics of inflation, and government fiscal balances.
Canada has a diversified economy, but it has significant exposure to commodity price cycles and it is a relatively trade-oriented economy that ties domestic economic performance to international cycles. Looking at the volatility in real GDP growth over several decades, one can find times where the Canadian economy has experienced higher and lower growth relative to its peers. On average over the past several decades, the Canadian economy has been somewhat more cyclical than its peers.
One factor that contributes to economic stability is labour market flexibility. Canada has well-regulated labour markets, but firms have the flexibility to adjust payrolls in response to economic cycles. Workers are also mobile. Although there is some labour rigidity from provincial regulations, workers can generally move to take advantage of jobs in other jurisdictions. This can be observed in the intra-provincial migration statistics that show individuals moving to lower unemployment regions.
Inflation in Canada has been stable over the medium to long term. Since the Bank of Canada adopted its 1 to 3 percent inflation target band, with a mid-point target of 2 percent, it has on average managed to hit that target almost exactly. Compared to its peers, Canada’s inflation rate was less volatile between 2008 and 2017. Low, stable inflation is desired to preserve the value of money and support economic stability. The Bank of Canada has been successful at anchoring inflation expectations at 2 percent, which not only contributes to price stability but also reduces the volatility in interest rates.
Going forward, medium-term risks to Canada’s economic stability include the combination of high household debt and potential excessive valuation in real estate (as discussed in the customers pillar), as well as recent US tax reforms (as discussed in the tax pillar) that could constrain investment and greater future demographic pressures on provincial fiscal balances.
Canada’s general government net debt is well below that of its peers on average
The Canadian government’s fiscal position remains an area of strength compared to its peers. While Canada has a high gross debt-to-GDP ratio compared its peers, it also has significant financial assets such that its net debt-to-GDP ratio was the fourth-lowest among its peers in 2017. Only Australia, Sweden, and South Korea had smaller ratios. Moreover, Canada’s net debt-to-GDP ratio was less than half that of peer countries on average between 2008 and 2017.
While this ratio overall is low, it is largely a result of the federal government’s favourable fiscal position, as the fiscal outlook for many Canadian provinces is concerning. Rising healthcare costs associated with aging populations will create significant fiscal demands at a time that tax revenue growth will be modest. This will raise provincial debt in the years ahead. Unsustainable fiscal policies can weaken competitiveness because they erode the scope for fiscal policy to provide support during economic downturns and can lead to higher tax rates in the future that can deter investment and diminish competitiveness.
General Government net debt (% of GDP)
Capital and Investments
Weak investment continues to drag on productivity
Canadian businesses invest less than their peers
A key factor restraining Canadian business competitiveness is under-investment in productivity- enhancing machinery and equipment.
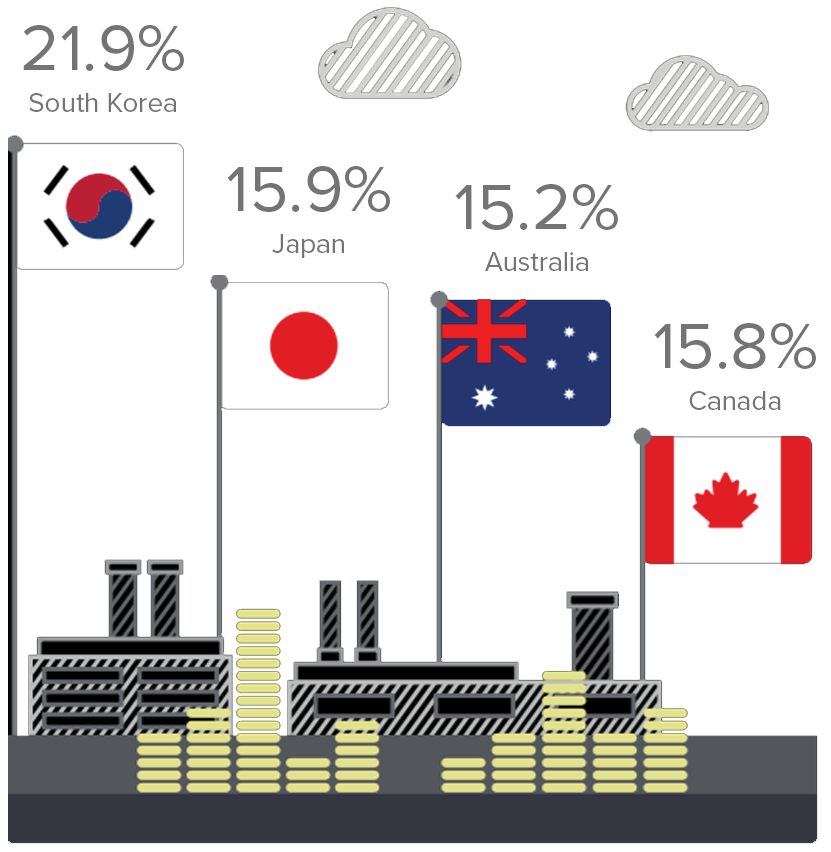
At 10.8 percent of GDP, Canada’s private gross fixed capital investment (a measure of the overall investment in physical assets within an economy such as plants, machinery, and equipment, as well as intellectual property) was the second-lowest among peer nations in 2017 and has been persistently lower than peers such as South Korea, Australia, and Sweden since 2008.
While it has fluctuated somewhat over time, nonresidential investment per labour force participant in Canada has consistently been below the OECD average, and was 20 percent below average in 2017. There is a cyclical component of the story; the commodity price correction in 2014-15 depressed investment in Canada’s resource sector. But, this does not alter the fact that investment on a structural basis has been weak.
Business investment outside of the resource sector was also lacklustre. Indeed, it was below the rate of depreciation for a couple of years. Business investment did pick up in 2017-18, but the pace has been moderate, particularly given the high levels of operating capacity that suggests the need for more investment.
Private gross fixed capital spending as a share of GDP (2017)
Weak investment in machinery and equipment has consequences to Canada’s competitiveness, as it is likely constraining labour productivity, which limits economic growth and wage gains. Poor investment can also curb the adoption and diffusion of new technologies. It can hamper commercialization of new innovations as well, which can temper demand for new R&D activities.
The key question is: why have organizations not been investing? There are a variety of possibilities, including risk aversion in uncertain times, a slow- growth environment that limited demand growth and the need for more capacity until recently, lower commodity prices that reduced returns on capital investments in the resource sectors, unrealistic expectations of capital returns in a low interest rate world, and/ or poor business optimism regarding the policy environment, including difficulty getting national infrastructure projects approved, carbon pricing, rising minimum wage rates, US protectionism, etc.
While the causes of low levels of investment may vary by sector, the consequences to the Canadian economy are clear.
In Canada, access to capital is good. Credit given to non-financial corporations amounted to:
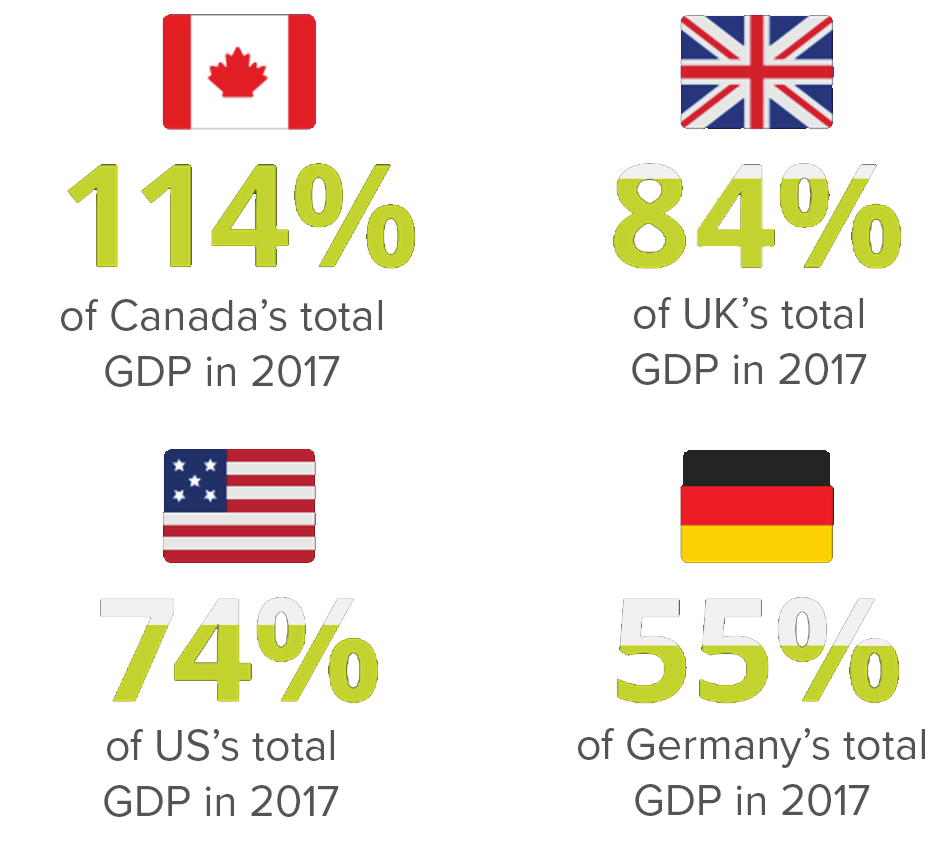
The extent to which Canadian businesses are able to access credit is a key contributor to the Canadian economy’s ability to grow, innovate, and remain competitive.
In 2017, total credit to non-financial corporations amounted to 114 percent of Canada’s GDP, higher than lending to corporations in nine peer nations including Germany, the UK, and the US. This metric captures both bank and non-bank lending (loans and debt) from domestic and foreign sources. In addition, lending to non-financial corporations in Canada has increased more than all peers since 2007.
Thus, compared to its peers, credit to Canada’s non-financial corporations is not unduly constrained, suggesting that other forces may be driving low business investment in Canada. Reviews of Canada’s business investment challenge have pointed to several possible explanations.
Business investment choices can be shaped by macroeconomic determinants such as labour force availability, labour costs, prospects of future sales growth, currency fluctuation, and uncertainty over economic policy. Falling or depressed corporate profits can also constrain business investment.
However, Canadian businesses are operating at high levels of capacity and net operating surplus across Canadian firms have returned to pre-recession levels—suggesting Canadian companies may be in a position to invest further, but may be discouraged by other factors.
While the precise drivers of why Canadian companies don’t invest may vary by sector, size, and location— access to credit appears not to be constrained in Canada, suggesting other structural features of the economy could be deterring Canadian companies from investing. Thus, from a competitiveness standpoint, access to capital—which has been improving in recent years—can be viewed as adequate for economic growth. As the Canadian government seeks to grow the economy, designing effective tax, regulatory, and infrastructure regimes that can help stimulate business investment will be an important means to trigger economic growth.
The pool of venture capital in Canada has improved in recent years, but challenges remain
Venture Capital (VC) has a unique role in the economy as it can provide financial capital to businesses as well as critical management expertise and guidance that can set companies up for success. The volume of venture capital in Canada has grown in recent years.
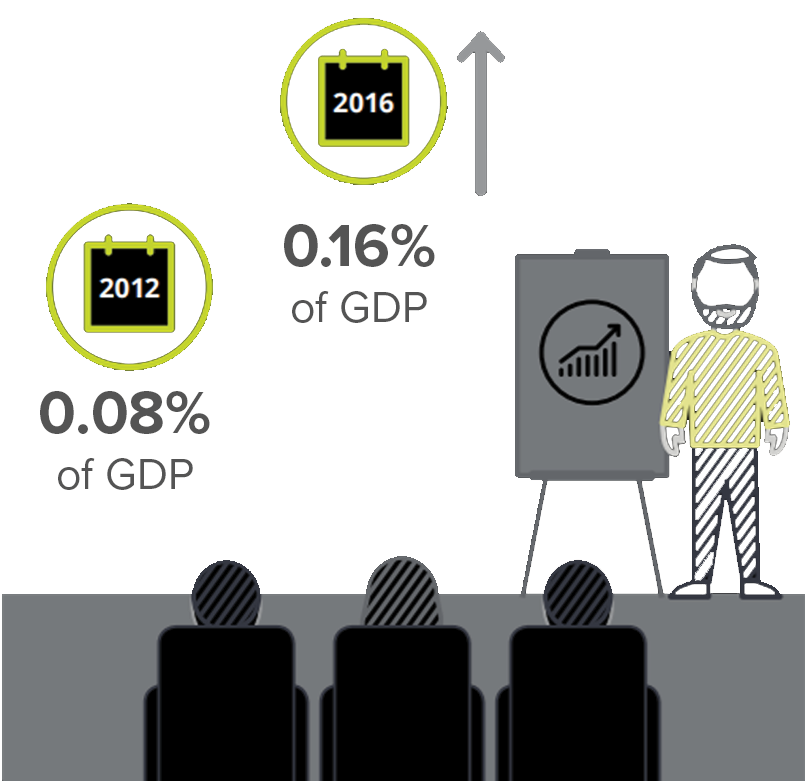
VC investment as a share of GDP in Canada was greater than all its peers except the United States and Israel; it amounted to approximately 0.16 percent in 2016.
In 2016, the value of VC investments increased from $3.2 billion, up from $1.5 billion in 2011. This was coupled with a 19 percent increase in the number of fundraising rounds over the same period. Improvements in the flow of VC in Canada can be partially attributed to policy action among Canadian governments, which have invested in several VC funds as a means to stimulate investment.
However, other elements of Canada’s VC activities demonstrate areas of weakness. Its VC performance can lag behind that of its peers. For example, Canadian companies have smaller exit values than those in the United States and take longer on average to receive funding after their founding.
This suggests Canadian venture capitalists demand to see more progress from a company before extending initial financing, and therefore have a lower risk tolerance than their US counterparts.
A 2017 report by the Business Development Bank of Canada found that while the performance of select Canadian VC funds improved between 2013 and 2016, with the 10-year internal rate of return moving from negative to positive during that time, Canadian VC returns continue to lag behind comparable US benchmarks.
Other reviews have identified insufficient levels of late-stage growth capital in Canada as a key challenge for Canadian businesses seeking to scale.
In the long run, a thriving VC market can help to retain technology talent in Canada and help companies successfully scale. Canada’s VC market has matured and improved in recent years. However, as the country seeks to establish its position as an innovation leader, further enhancing the strength of its VC market will play a critical role.
Customers
Canadian firms are losing global market share and private sector debt is climbing
Canadian companies are losing global market share
Canadian firms are constrained by a small domestic economy, which is also fragmented by interprovincial trade barriers. Canada’s economy is only 1.4 percent of the world economy. Accordingly, while taking maximum advantage of the domestic market, Canada’s economic competitiveness is contingent upon businesses achieving success in global markets.
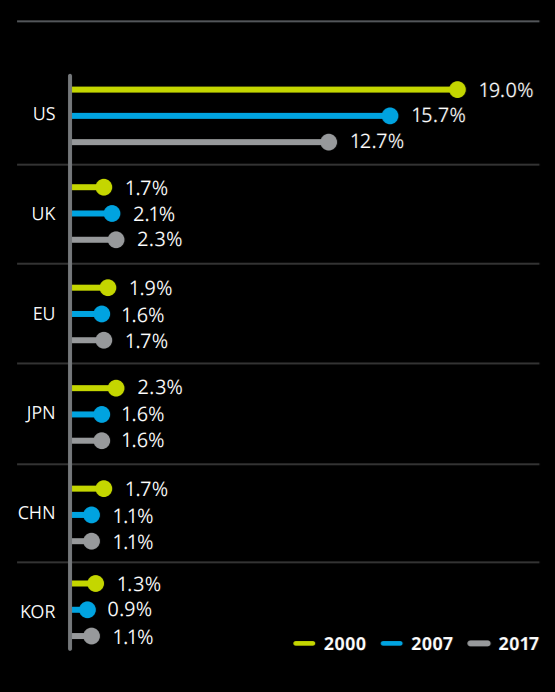
Today, roughly 70 percent of Canadian goods and services exports are delivered to the United States. While this can be explained by geographic proximity and common market features, approximately 83 percent of global GDP is outside the United States, suggesting Canada may be missing out on valuable opportunities in other markets.
Through negotiation of numerous free trade agreements around the world, the Government of Canada has created the opportunity for businesses to tap international markets.
Incrementally, there have been signs that Canada has been increasing its exports to non-US countries. In 2017, its exports to India, South Korea, Germany, China, and the United Kingdom rose.
However, with trade remaining overwhelmingly dependent on the United States, businesses could do more to diversify their exports and imports.
Troublingly, in major markets where Canada traditionally had a foothold, the country’s share of goods imports has declined or stagnated.
Canada’s diminishing performance in these markets could be attributed to several factors, including increasing competition from its peers, worries about the rise of protectionism, trade policy uncertainty (such as ratification of some free trade agreements), a lack of international sales success, or risk aversion among Canadian businesses, all of which can prevent them from considering foreign markets. Effective and continued policy focus on curtailing protectionism and promoting trade diversification is needed to enable and encourage Canadian companies to access broader market opportunities around the world.
Debt in Canada has increased in recent years, exposing the economy to potential risks
Canada racked up considerable debt in recent years, fuelled in part by a sustained, exceptionally low interest rate environment. The pace of debt growth has been greater than many of its international peers, creating an economic vulnerability. Markedly higher interest rates or an economic downturn could trigger a deleveraging.
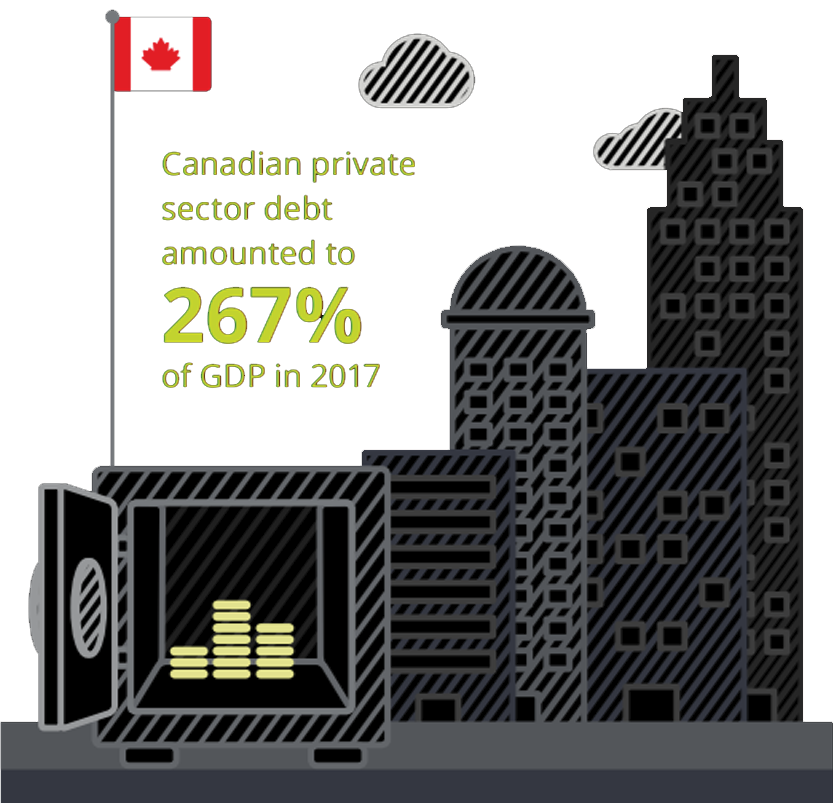
Canadian private sector debt (inclusive of households, non-profit institutions, and non-financial corporations) as a percentage of GDP stood at 267 percent—third-highest among its peers, and has consistently climbed over the past decade.
Growth in household debt has been a particular concern. The bulk of the debt accumulation has been in real estate-related borrowing, including mortgages and home equity lines of credit. The household debt- to- income ratio stood at 171 percent in Q2 2018, up from 149 percent 10 years ago. However, debt service costs have been relatively stable at around 14 percent of after- tax income. Rising interest rates could raise debt service costs over the next couple of years.
Canada’s high personal debt is a vulnerability, but it is dominated by prime rather than subprime loans, which lowers the risk profile. There have been several rounds of regulatory action aimed at reducing the risk from high household debt.
For example, income stress tests on mortgages ensure that households can meet their financial commitments if interest rates were 2 percentage points higher. Accordingly, the greatest risk is not mortgage defaults, but rather the risk that a consumer deleveraging would weaken consumer spending, which is roughly 60 percent of GDP.
Private non-financial corporations have also increased their debt significantly over the past decade. Since the commodity correction in 2014-15, private corporate debt and loan growth has exceeded asset growth. Corporate balance sheets are not sending strong alarm bells, but leverage has increased.
The high level of debt in Canada poses a competitiveness issue in that it may limit domestic market growth for Canadian firms. Government debt has also been climbing, which could lead to higher taxes. These elements combined could diminish the economy’s ability to compete and grow.
Infrastructure
The quality of infrastructure lowers Canada’s competitiveness
The business community believes Canada’s economic infrastructure lags that of its peers
Infrastructure enables companies to move goods and people to vendors, suppliers, and customers. The perceived quality of Canada’s general infrastructure reported in the Global Competitiveness Index is just below that of its peers on average and has decreased in recent years, reflecting of a lack of confidence in the Canadian business community about the efficacy, coverage, or accessibility of national infrastructure.
When asked by the World Economic Forum in 2017 about the state of Canada’s general infrastructure (e.g., transport, communications, and energy), Canadians scored general infrastructure as a 5.7 out of 7, relatively on par with their peers on average (5.8). However, Canada ranked lowest in terms of perceived road quality, ranking ninth among 13 in 2017.
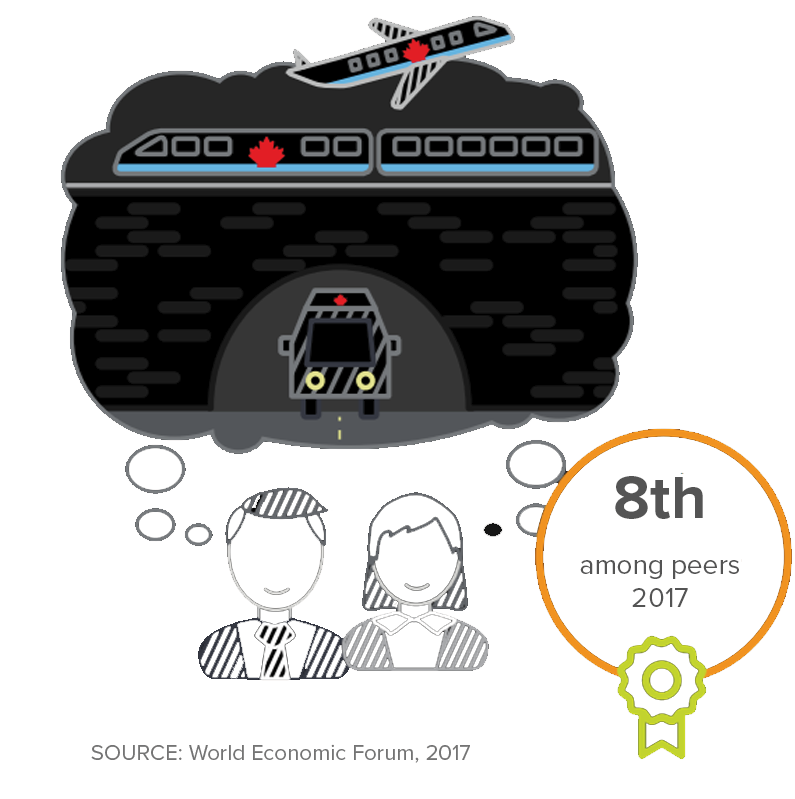
Rail quality is perceived to be the weakest transportation infrastructure, with Canada ranking eighth among its peers in 2017. While the United States is only in sixth place, it has improved the quality of its rail infrastructure during the past decade, while that of Canada’s has decreased. Perceptions of Canada’s electricity and telephony infrastructure quality improved between 2010 and 2017, but nonetheless ranked 11th of 13.
Taken together, these results are likely informed by challenges Canadian businesses have encountered while moving people and delivering goods and services across the economy. It is important to note that Canada’s poor performance in this regard comes at a time when Canada’s net stock of infrastructure per person is relatively high and has been steadily increasing since 2000. Nonetheless, these perceptions are not entirely surprising.
Total infrastructure spending as a fraction of GDP fell across all levels of government between 1961 and 2004. In recent years, this trend reversed as government infrastructure spending per person rose between 2000 and 2015.
Today, the federal government has prioritized infrastructure investment as a central feature of its economic policy, establishing the Canadian Infrastructure Bank and developing a $120 billion infrastructure investment plan. Making progress on improving infrastructure will be a key step in restoring businesses’ confidence in their ability to capitalize on infrastructure to unlock new market opportunities.
Canada struggles with several infrastructure challenges
There is a strong economic rationale to enhance Canada’s infrastructure investment. Such projects can stimulate the economy and improve business logistics and overall quality of life. Canada’s infrastructure gap—the difference between a country’s investment needs and what is required under current trends to meet demand for infrastructure—is lower that that of its peers.
Canada’s infrastructure gap in 2018 was only 0.03 percent of GDP.35 This is in contrast to 0.56 percent for the United States and 0.14 percent for the United Kingdom.
Additionally, Canada is projected to outspend some of its peers on infrastructure. By 2025, Canada and the United Kingdom are expected to spend 1.8 percent of GDP in contrast to the United States at 1.53 percent. Despite a relatively favourable infrastructure investment profile compared to its peers, there is significant scope to improve Canadian infrastructure, especially critical transportation infrastructure in urban areas.
Between 1996 and 2016, the number of commuters has risen 30 percent in Canada. With more congestion, commuting times are getting longer for those using road networks.
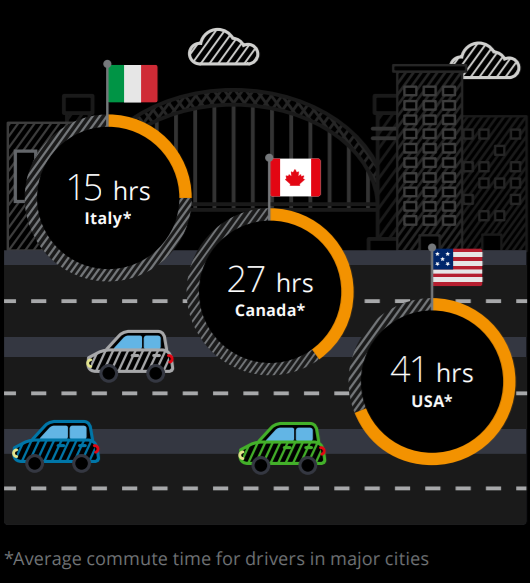
In 2017, Canada placed 16th in the world on the INRIX Congestion Index, a weighted average of the number of peak hours spent in congestion in a
country’s major cities. In 2017, Canadian drivers spent an average of 27 peak hours in congestion, longer than their peers in France (22 hours), Spain (17) and Italy (15), for example, but less than commuters in the US (41), the UK (31) and Germany (30).
Similarly, from 1996 to 2016, the number of commuters taking public transit grew by 59.5 percent leading to pressures in major cities that struggle to keep up with demand.
The quality of Canada’s trade and transportation infrastructure (e.g., ports, railroads, highways) ranked 21st in the world in 2018 according to the World Bank, well behind the United States (seventh) and Germany (first). Canada’s geographic expanse and harsh climate make high-quality infrastructure challenging. For businesses, inadequate infrastructure can raise logistical costs that may be passed on to customers or limit market access, diminishing the quality of the Canadian business environment. The lack of infrastructure can be costly. For example, inadequate pipeline expansion has cost Canada billions in foregone revenue from oil exports.
Innovation
Canada has fallen behind its peers in its innovation performance
Canada has consistently spent less on research and development than its peers
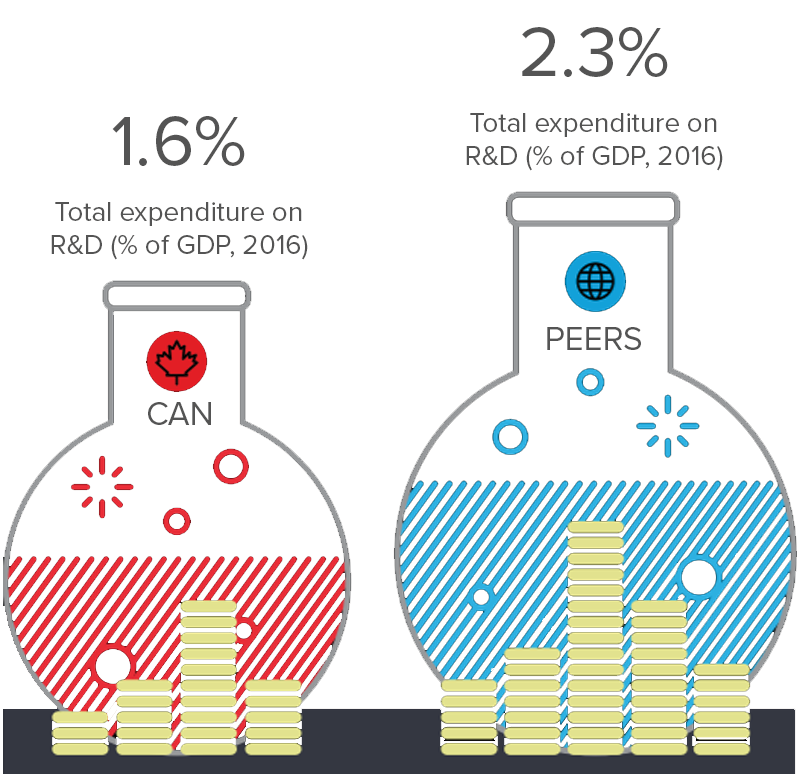
Despite successive attempts to stimulate innovation, the share of innovation-related activities has not increased in Canada’s economy.
Relative to its peers, Canada has consistently spent less on research and development activities as a share of GDP. Additionally, Canada’s gross expenditure on research and development (public and private) has declined since 2007. These declines occurred at the same time peers such as France, Germany, Sweden, and South Korea have increased spending, widening the gap Canada must now close to remain competitive.
Canada’s business expenditure on research and development on a per capita basis has also declined since 2007, at the same time its peers have increased their spending per capita.
Additionally, a larger share of total research and development spending in Canada comes from universities and colleges compared to peers such as Germany and the United States. While fundamental research is vital to innovation, academic research can be slower to commercialize than research undertaken by the private sector.
Canada’s poor innovation performance naturally leads to a review of the efficacy of Canada’s innovation public policy. Canada’s scientific research and experimental development (SR&ED) tax credits are some of the most generous in the world and the country is home to several incubators, innovation centres, and public-private research partnerships. Reviews suggest the discrepancy between efforts to encourage innovation and actual performance may be due to a misalignment between the incentives and the needs of businesses.
Firstly, the administrative burden and cost associated with filling out the necessary forms and files to access SR&ED credits have been identified as eroding the efficacy of the incentive. Secondly, large firms that typically would access SR&ED credits are finding alternative ways to get new technology. For example, companies are increasingly relying on working with or acquiring startups to develop new technologies to suit their needs. In sum, relying on SR&ED credits as a key innovation incentive may not be matching the needs of the business community.
Canada’s ability to design and implement incentives that successfully encourage business and government investment in research and development will be critical to enhance competitiveness on the global stage and close the gap with its peers.
On a per-capita basis, Canada produces fewer patents than its peers
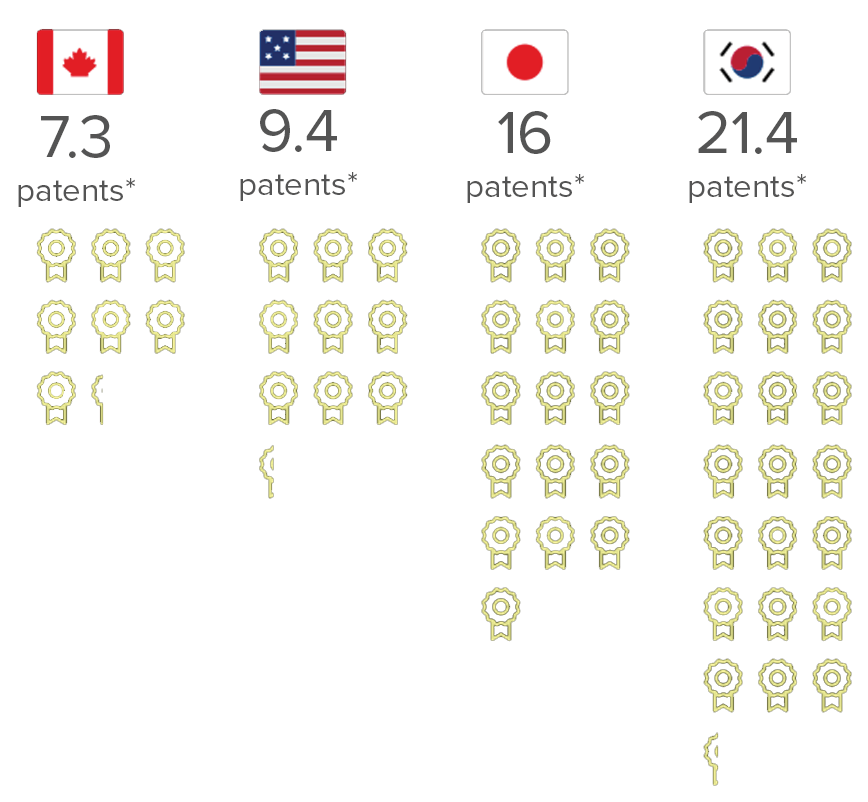
Canada’s innovation performance is poor relative to peers and has declined further in recent years. Canada has dropped in the Global Innovation Index over the past 10 years, from eighth in 2006 to 18th in 2018 despite successive government initiatives aimed at enhancing productivity. The index measures the calibre of economies’ innovation ecosystems.
One element assessed in the index is the extent to which a country is successful in creating knowledge and technology outputs, including patents. For years, Canada has lagged behind peers such as the United States, France, and South Korea in the development of intellectual patents per capita. Canada’s performance in this regard has remained relatively flat since 2007, with a modest increase in 2016, despite having generous tax credits and incentives in place to support innovation.
Counting patents per capita can be a means of gauging how well countries transform knowledge into usable inventions. Countries with more patents are in a better position to pioneer new-to-world technologies and therefore derive above-average economic gains from intellectual property.
Moreover, intellectual property can be transformed into goods and services to be sold all over the world, thereby contributing to corporate profits and overall economic growth.
Reviews of Canada’s poor intellectual patenting track record point to a need for additional emphasis and support for university/academic collaboration as a means to increase the likelihood of developing commercializable products that can be patented and achieve market success. Additionally, ensuring the cost of patenting is not prohibitive has also been identified as a meaningful way to support further patenting activity.
The advantages of enhanced intellectual patenting activity are clear—how Canada’s current innovation regimes are adapted and improved will be a key determinant of the nation’s overall innovation competitiveness. More accessible patenting regimes can be expected to increase competitiveness.
Canadian exports are less technology-intensive compared to those of its peers
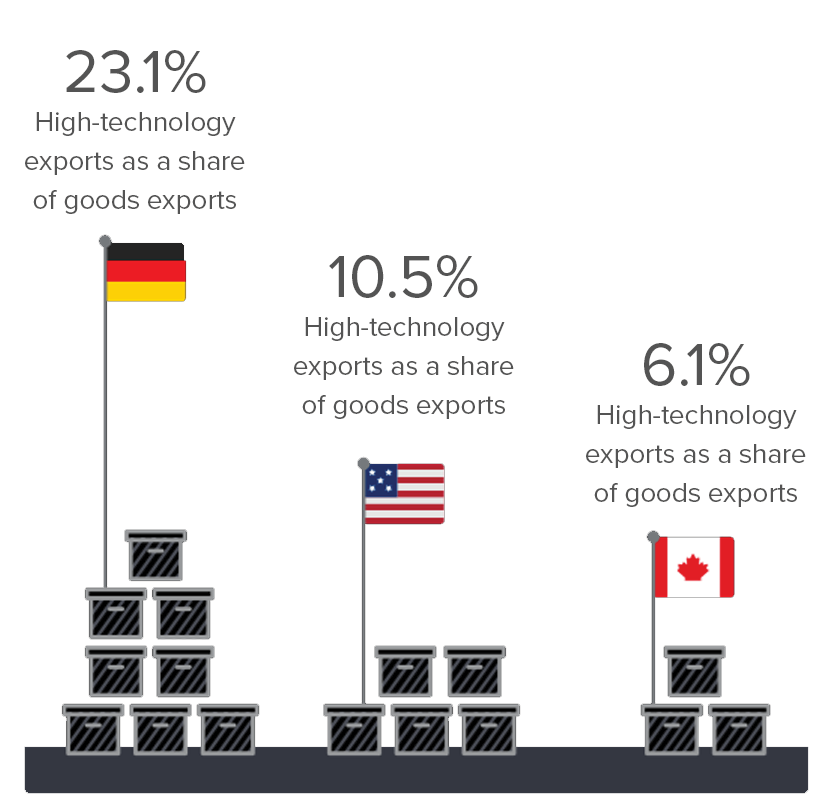
Canada’s economy is export-oriented. Therefore, a review of its innovation performance requires analysis of the extent to which Canada exports its innovations around the world. High-technology exports—defined as exports of products with high R&D intensity, in sectors such aerospace, pharmaceuticals, scientific instruments, and electrical machinery—can be an indication of a country’s ability to produce and sell innovation.
A review of the data on high-technology exports finds that Canada’s research-intensive exports are lower than those of its peers as a share of goods exports, suggesting Canadian firms may not be involved in innovative value chains relative to others.
High-technology exports represented only 6 percent of Canada’s total goods exports— lagging behind South Korea (23 percent), France (20 percent), and Germany (17 percent) in 2016. Canada ranked 11th among its peers by high-technology share of total goods exports.
Notably, Canada’s overall positioning has worsened somewhat since 2007, staying relatively flat while peers such as Germany and France saw increases in the high-technology share of their exports.
Combined, these results may reflect the fact that Canada’s value chains in research-intensive industries may not be as advanced or as able to command high prices compared to its peers. Canada’s flat-lining performance in this regard comes at a time when Canada is also losing valuable market share in places such as South Korea and Japan, which are innovation leaders.
Being a strong exporter is a key determinant of economic success. This dimension of Canada’s trade profile adds nuance to the intersection between its innovation and trade performance. When the value of its innovation-intensive goods exports is lower than that of its peers, Canada’s position in the marketplace can be viewed as weak. Not only does Canada need to access additional markets, it also needs to ensure it is able to increase the value of the goods it exports to ensure competitiveness with its peers in the marketplace.
Tax
The Canadian tax environment can be uncompetitive relative to the US
US corporate income tax cuts put Canada at a disadvantage
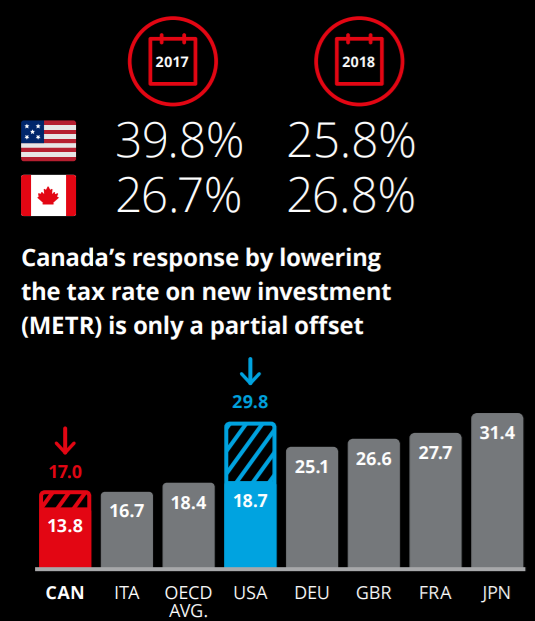
For many years, Canada enjoyed an advantage over its largest trading partner from a corporate tax perspective. However, the US government cut the federal corporate income tax rate by 14 percentage points (from 35 percent to 21 percent) in 2018, putting Canada at a disadvantage. The 2018 US combined corporate tax rate is now 25.8 percent (down from 38.9 percent) compared to the Canadian rate of 26.8 percent. The higher tax rate will mean that for the same level of profits, Canadian companies will have fewer after-tax dollars available for investment or payment of dividends to shareholders. This can curtail growth and reduce foreign investment. Moreover, US tax reforms went well beyond just the taxation of profits, measures that have provided the United States with a tax advantage.
In its 2018 Fall Fiscal Update, the Canadian government did not address the general tax disadvantage, but did announce that new investments could be expensed more quickly through accelerated depreciation allowances. The new policy reduced the effective marginal tax rate on new investments from 17.0 percent to 13.8 percent. Canada’s marginal effective tax rate (METR) on new business investment is now lower than that of the US and that of all other G7 nations. This gives firms a greater incentive to invest in machinery and equipment, as well as intangibles.
Tax rates are an important dimension of business competitiveness, particularly for Canada. Many international companies locate in Canada not only to serve the domestic market but also to access the much larger US market. In this way, companies can take on currency risks and logistical costs when serving US customers.
Faced with less favourable tax rates, cost-sensitive companies based in Canada, in particular, may rethink local expansion plans and potentially seek to relocate to the US. Additionally, uncompetitive tax rates could discourage new foreign direct investment in Canada.
Reducing Canada’s attractiveness to foreign investment could have lasting consequences on the economy. Research suggests that foreign companies in Canada create significant net benefits to the Canadian economy, including knowledge transfers, new management, better wages and productivity.
While the changes in the Fall Economic and Fiscal Update are a useful step, they only address tax competitiveness with respect to new investments made by companies and may have limited impact at a time when interest rates are rising. A close monitoring of capital flows into and out of Canada is warranted as firms respond to US tax changes and as other countries also make tax reforms.
Canada’s top income tax rate is the fourth-highest among its peers
2017 is the latest available OECD data. OECD methodology uses representative jurisdictions, as defined by member countries, to estimate tax rates. Ontario is the representative jurisdiction for Canada
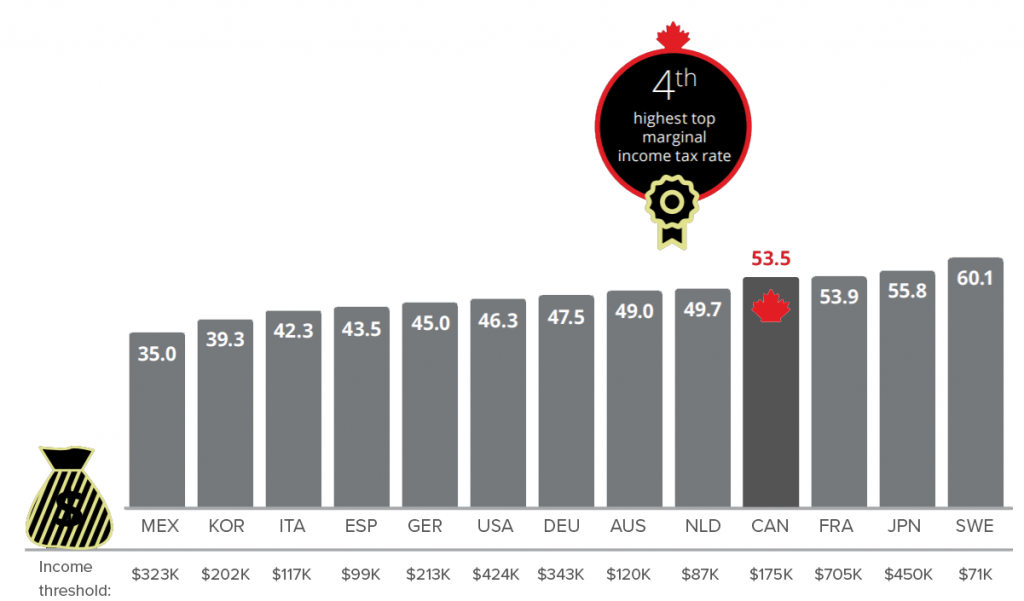
Canada’s top talent pays more income tax compared to most peer nations. With a marginal tax rate of of 53.5 percent for top earners, Canada’s top tax rate is the fourth highest.
Moreover, Canada’s top income tax rates kick in at lower income levels than its peers. A Canadian starts paying top marginal rates at roughly US$175,000, while top rates do not apply in Germany and the United States until earners reach income levels over US$340,000. In France, top income rates do not apply until income reaches US$705,000.
Canada’s top marginal tax rate increased 4 percentage points in 2016, the third- largest increase among peer nations in the past five years (Japan’s top rates increased by 5.2 percentage points in 2015 and Mexico’s by 5 percentage points in 2014). Top rates in France, Germany, and the United Kingdom did not change between 2013 and 2017.
As a policy tool, tax rates can change quickly, causing a nation’s relative competitiveness to swing. However, Canada’s persistently high top tax rates may make it less attractive for top earners to settle here.
2017 marginal labour income tax wedge (%)
Personal income tax rates can influence how attractive a jurisdiction is for international talent. In this regard, Canada can be viewed as uncompetitive relative to the United States.
The marginal tax wedge measures the share of an increase in labour costs that is paid in taxes and social security contributions less cash benefits.
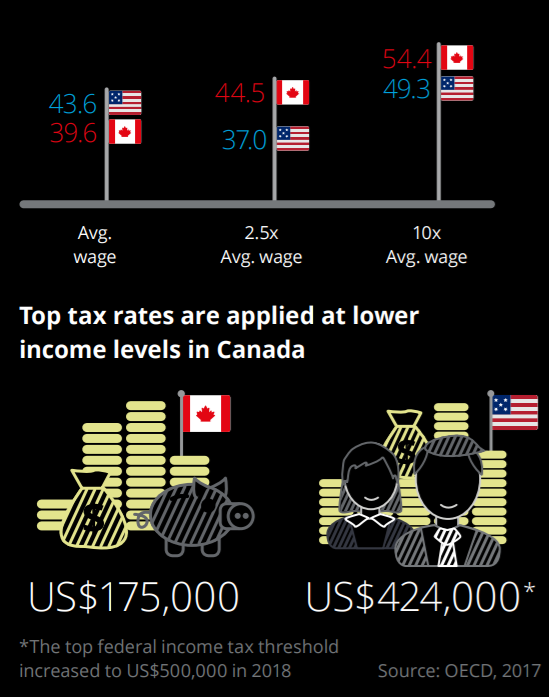
Canada’s marginal tax wedge for an average earner with no kids was 39.5 percent in 2017 compared to the US average rate of 43.6 percent. However, Canada’s income tax rates for higher earners are less competitive relative to the United States:
- For Canadians earning 2.5 times the average wage (just over US$100,000), the marginal income tax wedge is nearly 45 percent, compared to 37 percent in the US.
- For earners in the highest tax bracket, the marginal income tax wedge is just over 54 percent in Canada compared to just over 49 percent in the US.
- Moreover, top tax rates apply at lower income levels in Canada compared to the US. Canadians face top tax rates at an income of roughly US$175,000 while, in 2017, Americans started paying top rates once they earned above US$420,000.
2018 changes to the federal US tax structure widen the gap between the two countries’ top tax rates. The federal US top statutory tax rate decreased by 2 percentage points and the top income threshold increased to US$500,000 for states with a flat income tax regime.
Average rates hide differences across geographies as they are based on an OECD methodology that uses tax rates in Ontario and Michigan as representative jurisdictions for Canada and the US, respectively. Ontario’s competitive position compared to states such as New York and California is more favourable, but these top rates still apply at significantly higher income levels. Moreover, Canada’s tax rates are less competitive than those in Texas and other jurisdictions with low or no state-level income taxes.
One caveat is that while Canadians may pay more in personal income taxes, these taxes fund health care and public schooling—categories of expenses that people in some peer countries pay with their after-tax income.
Data nuances notwithstanding, high tax rates for top earners could make it more difficult for companies to attract and retain specialized and senior-level talent and attract foreign investment.
Research also shows that high personal tax rates can deter entrepreneurial activity, since there is lower after- tax compensation for taking significant risk. This could hamper Canadian productivity and innovation.
Regulation
Canadian firms can encounter a higher regulatory burden than their peers
Canada’s position on the World Bank’s Doing Business report has fallen since 2006
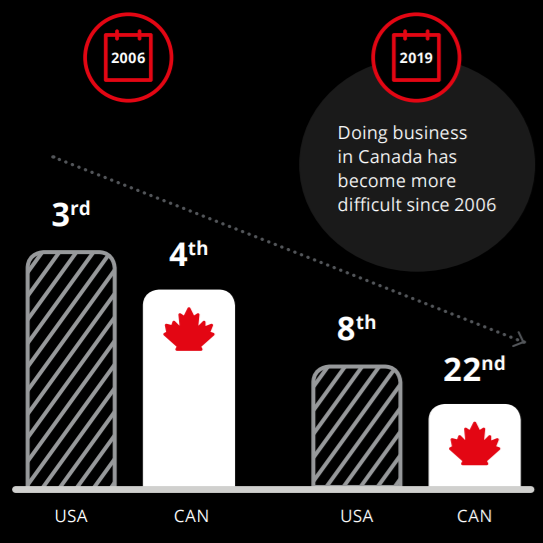
Canada’s position on the World Bank’s 2019 Ease of Doing Business report has fallen since 2006, from fourth in the world to 22nd. Regulatory challenges are evident. Canada ranked 63rd in the world in terms of obtaining construction permits, with it taking 249 days to get a permit for a warehouse.
In the 2018 World Economic Forum (WEF) Competitiveness Index, Canada ranked 12th out of 140 countries in overall competitiveness. This looks favourable on the surface, but a closer look at the details reveals a different picture. Canada ranked 53rd for burden of government regulation. Future orientation of government ranked 29th. 66 Labour policies were 22nd. Ease of hiring foreign labour was 81st.
Canada also does not compete equally with all 140 countries in the WEF Competitiveness Index. The United States is the destination and source for the majority of Canadian trade in goods and services, so it is Canada’s major competitor. Canada is at a considerable competitive disadvantage, as the United States has a better competitiveness rating than Canada in 10 out of 13 major categories in the index, and two ratings put them as equal.
In the 2017 Executive Opinion Survey, a component of the World Economic Forum Competitiveness Report, inefficient government bureaucracy (and tax rates) were identified as the first and second most problematic factors for doing business in Canada. While not precisely being about regulation, inefficient government bureaucracy certainly involves the administration of government regulations.
The Fraser Institute’s Economic Freedom Index, which measures several dimensions of human freedom, has consistently ranked Canada in the top 15 in the world overall. However, the Index found that Canada’s business regulations were more restrictive than the United States, United Kingdom, Switzerland, and Germany.
The Autumn 2018 Conference Board of Canada Business Confidence Index found government policy was reported as the most important impediment to investment, with more than half of businesses citing it as a concern.
In January 2019, the Business Council of Canada surveyed its members to get their views on the economy. 41 percent of respondents identified reduction of regulatory burden as the “one thing to improve Canada’s business environment.”
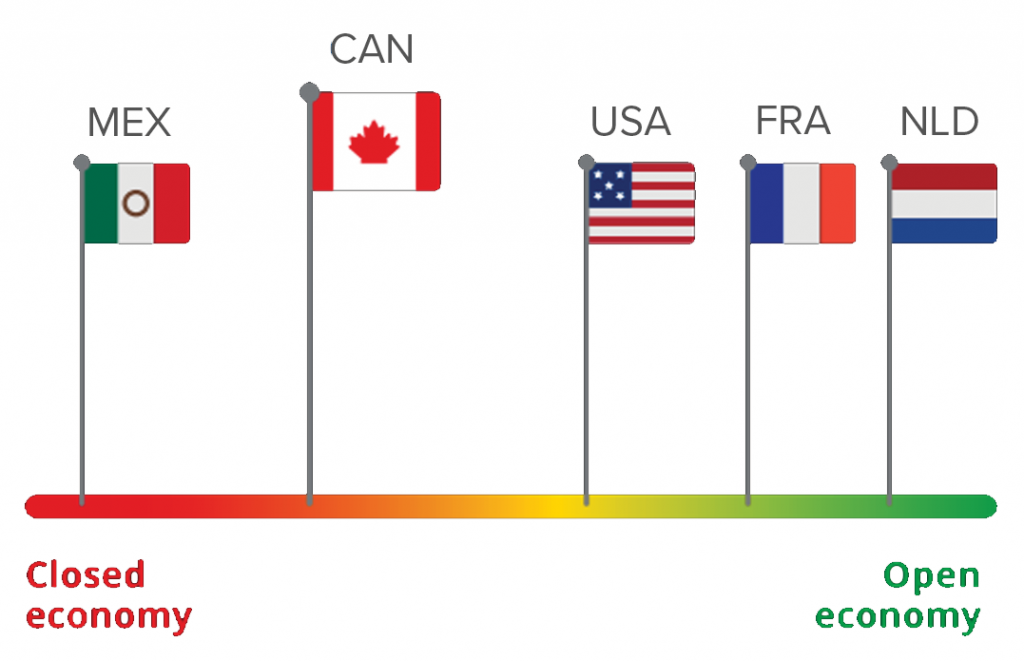
Canada is the second-worst in the OECD on openness to foreign direct investment
Compared with its peers, Canada can be viewed as relatively restrictive toward foreign investment. Since 2010, Canada has performed poorly on the OECD FDI Index, which measures statutory restrictions on foreign direct investment (FDI). The index, ranging from 0 (open) to 1 (closed), gauges the restrictiveness of a country’s FDI rules in four main areas:
- Foreign equity limitations
- Discriminatory screening or approval mechanisms
- Restrictions on the employment of foreigners as key personnel
- Other operational restrictions (e.g., restrictions on branching and on capital repatriation or on land ownership by foreign-owned enterprises)
At 0.16, Canada’s 2017 FDI Index was secondhighest among peers in terms of restrictions, behind only Mexico. Canada was significantly more restrictive than its peers in the Netherlands (0.015), Spain (0.021), and Germany (0.023). Additionally, Canada’s overall index was more restrictive than OECD countries on average (0.066).
Canada’s low ranking can be attributed to its equity restrictions and levels of screening and approvals required to invest. Both of these measures were found to be more restrictive than the OECD average.
FDI is a key channel in globalization. For investors, choosing to invest in Canada can diversify their holdings and potentially provide access to the North American market. Reciprocally, the Canadian economy can benefit from the injection of capital and best practices. Notably, the index captures only selected dimensions of Canada’s regulatory regime as it relates to FDI. For example, reviews of the country’s regulatory environment have consistently identified other challenges, such as the burden and complexity associated with successfully passing the federal government’s ‘net benefit’ test, which puts the onus on prospective investors to demonstrate how their investment plans would provide a net benefit to the country.
Canada’s poor performance in the OECD index is a clear signal to government to revise its approach to governing FDI or risk losing valuable opportunities to diversify the Canadian economy and attract new investment and jobs to the country.
It takes 168 more days to obtain a permit for new construction in Canada than in the United States
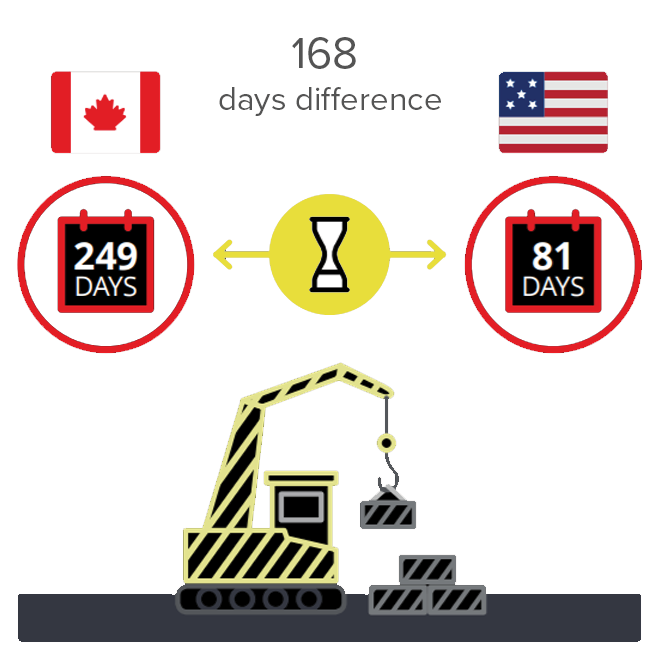
Businesses thrive when regulations serve the public interest but are not excessively and unnecessarily onerous in terms of time, effort, and cost associated with regulatory compliance. One of the elements measured by the World Bank’s Doing Business Index is the number of days it takes for a business to successfully obtain all the required permits to build a new warehouse.
In 2019, it takes 249 days to obtain all necessary permits in Canada—168 days more than in the United States.74 Notably, since 2010, peer countries, such as Germany, have made progress on streamlining regulatory processes to reduce the time lag and cost of regulatory compliance. For manufacturers, retailers, and the agricultural sectors, such a vast disparity between Canada and the United States can be particularly damaging for Canada’s competitiveness in instances where companies require supply chain, storage, or logistical access to a particular geography that could also be served by a location in the United States.
The World Bank’s finding highlights a particularly acute example of the challenges businesses can face when trying to set up a new building or office. Importantly, building permits are often under municipal jurisdiction, meaning businesses can encounter differing regulatory or administrative burdens from different municipalities. This can challenge companies’ ability to quickly set up additional sites or locations in markets across the country.
The issue of regulatory burden or complexity for new projects is particularly important to Canada. In recent years, several high-profile, landmark infrastructure investments in the resources sector have been delayed or rejected as a result of long and complex regulatory approval processes or a failure to meet the large breadth of requirements that projects now face. There is a strong rationale for ensuring environmental, social, economic, and stakeholder perspectives are assessed before giving large capital projects the green light. However, when projects are delayed or unable to proceed, the loss of valuable spending, jobs, and spin-offs can have a significant negative impact on the economy.
Finally, regardless of the size of the proposed investment, unnecessarily long regulatory processes can cause uncertainty and erode business confidence in Canada.