The Impacts of US Tax Reform on Canada’s Economy
Executive Summary
Our mandate
PricewaterhouseCoopers, LLP (“PwC”, “we” or “us”) was engaged by the Business Council of Canada to estimate the impact of the United States Tax Cuts and Jobs Act (“US tax reform” or the “Act”) on the Canadian economy. The Act was passed in December 2017 with the intention of stimulating greater investment in the US and incentivizing US multinationals to repatriate income held abroad.
In this context, there is potential for the US tax reform to cause a shift in business investment from Canada to the US, resulting in a loss of economic activity in Canada. To assess the extent and likelihood of such consequences, we have taken the following three major steps:
- Identified sectors in the Canadian economy that may be at risk of losing future investment as a result of the US tax reform (“Affected Sectors”).
- Assessed the drivers of investment in these identified sectors and in that context the relative importance of taxes.
- Concluded on the likely impact of the US tax reform on the long-term economic viability of each of the identified sectors.
In addition, we have assessed the impact of changes to personal income tax rates in the US on Canada’s ability to attract and retain high-skilled talent relative to the US, and examined the impact of the US tax reform on the
attractiveness of conducting research and development (“R&D”) in Canada relative to the US.
We have also been asked to provide a list of policy options for consideration by the Canadian federal government in its quest to avoid negative ramifications of the US tax reform on the Canadian economy.
Our findings
Affected sectors
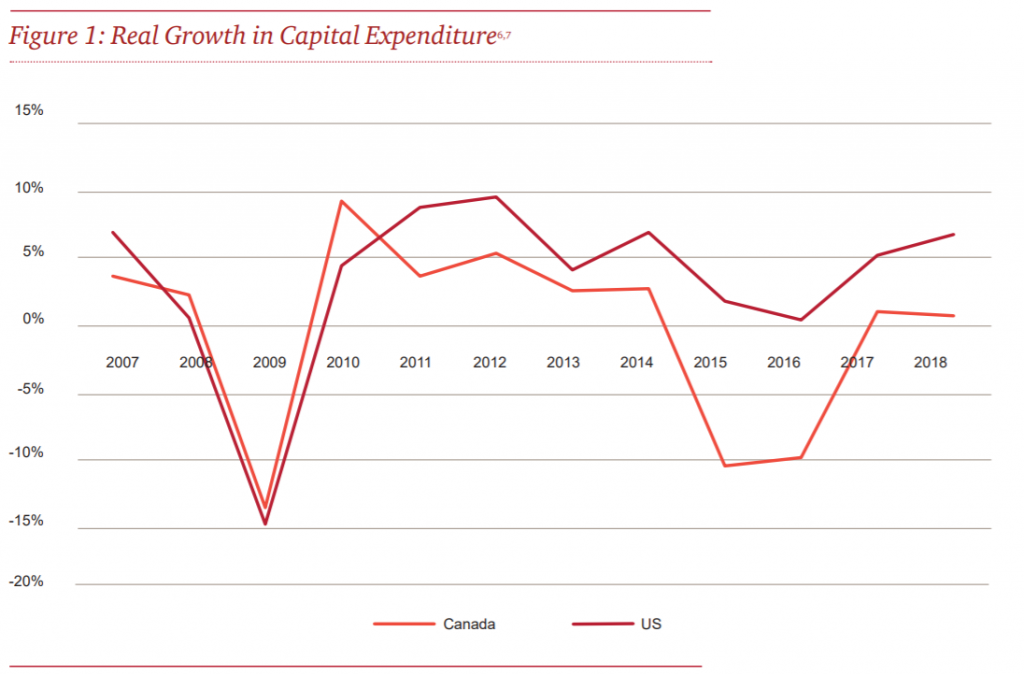
Our analysis suggests that the US tax reform has eliminated one of Canada’s main competitive advantages. We are of the view that this loss will have a significant negative impact on capital-intensive sectors in Canada. All else being equal, these sectors as a whole would likely face a significant shift in investments from Canada to the US over the next 10 years. It is important to understand that the US tax reform comes at the heels of a decade where Canadian capital-intensive sectors were generally lagging their US counterparts in both GDP growth and investment growth. Over the last decade, during which the Canadian corporate tax rate was substantially lower than that in the US, growth in capital expenditures in Canada was significantly slower than in the US. The US tax reform removes a key Canadian advantage, thereby exacerbating the trend of lower investment growth in Canada and threatening the viability of certain parts of Canada’s capital-intensive sectors.

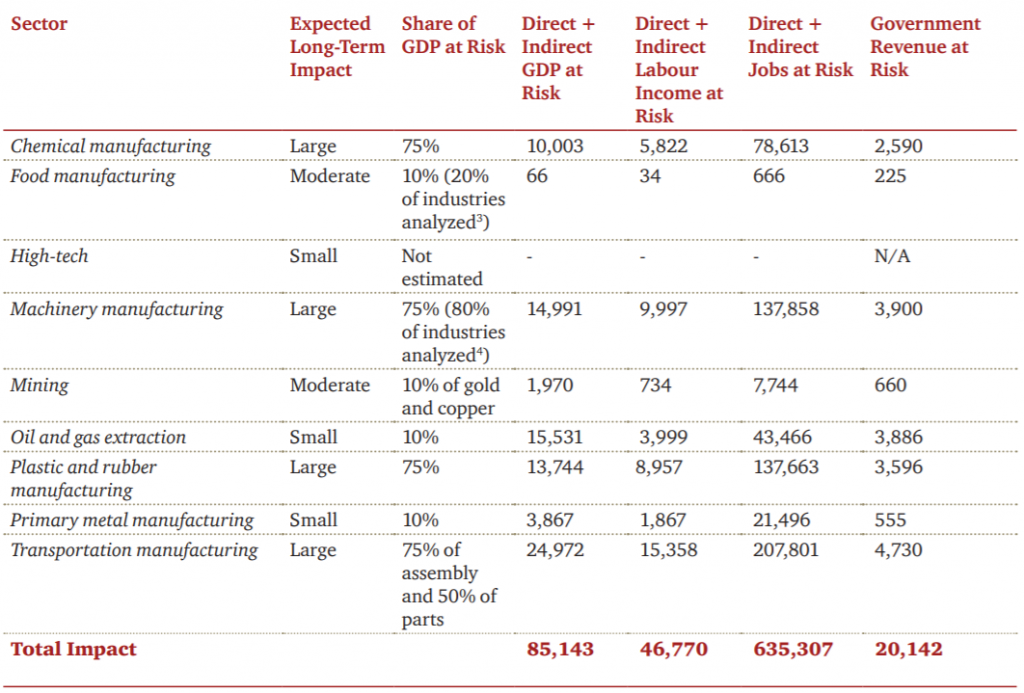
The following table summarizes the existing economic activity that we assess as being at risk of becoming unviable. It includes both the at risk portions of the Affected Sectors (direct impacts) and the activity of Canadian suppliers to those sectors (indirect impacts). In total, we assess that approximately $85 billion CAD in GDP (or 4.9% of Canada’s GDP), 635,000 employees (or 3.4% of Canadian employment), $47 billion CAD in labour income, and $20 billion CAD in government revenue are at risk as a result of the US tax reform. These figures exclude the loss of opportunity to establish new industries or expand existing industries as a result of the digital revolution. Due to data limitations, we have not quantified any loss in the high-tech sector. However, our assessment is that any loss of economic activity in this sector would be relatively minor.

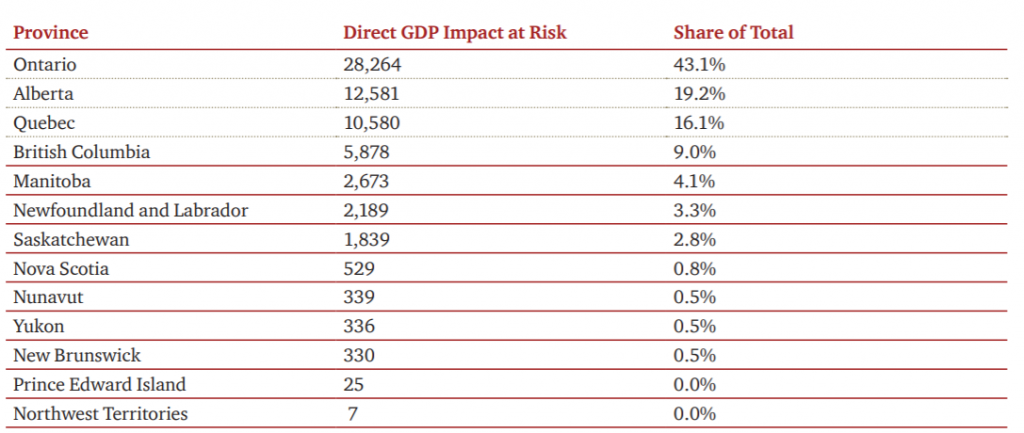
The table below shows the direct GDP impact at risk by province. Ontario, Alberta, and Quebec will experience the largest impacts because of their relatively high concentration of Affected Sectors.
R&D
R&D activity creates high paying jobs and is essential to driving productivity growth. Like most countries, Canada and the US both offer tax credits designed to encourage R&D activity.
Overall, the US tax reform has decreased the net effectiveness of Canada’s SRED (i.e. scientific research and experimental development) credits for US-based companies and increased the net effectiveness of US R&D credits. This is likely to lead to a reduction in R&D activity by US-based companies in Canada, including the spill over benefits that such activity creates. Currently, R&D conducted by US companies in Canada accounts for at least 11% of total private R&D pending in Canada.
Brain Drain
Our analysis suggests that the lower personal income tax rates introduced by the US tax reform will increase the net income gap between the US and Canada, especially in highly skilled occupations. The net income gap is already substantial due to higher wages and lower personal income taxes in the US, which makes the US more attractive to highly skilled workers. The US tax reform therefore marginally increases incentives for highly skilled Canadian workers to relocate to the US and makes it more difficult for Canada to attract highly skilled foreign workers.
The net impact of the US tax reform will likely be limited to an incremental increase in emigration of a few thousand employees per year. However, it will come at a time when Canada needs to reverse the existing brain drain phenomenon in order to ensure that it will emerge a “winner” from the digital revolution that it will likely face over the next 5 to 10 years.
Policy Options
We developed several policy options for consideration of the federal and provincial governments that we believe can act to counteract the negative impacts of the US tax reform. The following is a list of those options:
Tax options
- General corporate income tax measures
- The federal and provincial governments gradually reduce the combined statutory rate to 20% by 1% per year.
- Canada introduces a 100% bonus depreciation for seven years on equipment, structures and acquired intangibles.
- Canada introduces a longer loss carry-back period. A longer loss carry-back period would support resource companies whose earnings are cyclical and can be volatile.
- Brain drain counter measures – personal income tax measures
- Canada increases the personal income tax brackets to closer resemble the US personal income tax brackets.
- The federal and provincial governments reduce the combined top marginal statutory rate to 49%.
- Innovation measures
- Canada reviews its SRED program both from an effectiveness and an administration perspective. The objective is to create a behaviour driving, best-in-class R&D program that, among others, will avoid the negative impact of the US tax reform on the current Canadian SRED program.
- Canada introduces an intellectual property (“IP”) regime (also referred to as a “patent box”).
Funding options
- Tax base expansion measures
- Canada continues to expand its corporate income tax base.
- The federal and provincial governments further increase the personal income tax base.
- Consumption tax measures
- The federal government gradually increases the GST rate.
- The federal and provincial governments agree to introduce one unified carbon tax and use the revenue to reduce
corporate and personal income taxes.
Other policy options
- Administration of income taxes
- Canada (i.e. the Canada Revenue Agency) significantly improves the efficiency and effectiveness of the
administration of Canada’s corporate and personal income taxes.
- Canada (i.e. the Canada Revenue Agency) significantly improves the efficiency and effectiveness of the
- Regulatory approvals
- Canada’s federal, provincial and territorial governments significantly simplify and shorten approval processes for
large-scale projects and reduce the uncertainty of the outcome of these processes.
- Canada’s federal, provincial and territorial governments significantly simplify and shorten approval processes for

Introduction
PricewaterhouseCoopers, LLP (“PwC,” “we” or “us”) was engaged by the Business Council of Canada to estimate the impact of the United States Tax Cuts and Jobs Act (“US tax reform” or the “Act”) on the Canadian economy. The Act was passed in December 2017 with the intention of stimulating greater investment in the US and incentivizing US multinationals to repatriate income held abroad.
In this context, there is potential for the US tax reform to cause a shift in business investment from Canada to the US, resulting in a loss of economic activity in Canada. To assess the extent and likelihood of such consequences, we have taken the following three major steps:
- Identified sectors in the Canadian economy that may be at risk of losing future investment as a result of the US tax reform (“Affected Sectors”).
- Assessed the drivers of investment in these identified sectors and in that context the relative importance of taxes.
- Concluded on the likely impact of the US tax reform on the long-term economic viability of each of the identified sectors.
In addition, we have assessed the impact of changes to personal income tax rates in the US on Canada’s ability to attract and retain high-skills talent relative to the US, and examined the impact of the US tax reform on the attractiveness of conducting research and development (“R&D”) in Canada relative to the US.
In conducting our analysis, we have focused on the impacts of the changes to the US tax code that are most likely to affect investment in Canada, as follows:
- The lowering of the statutory corporate income tax rate.
- The introduction of immediate capital expensing.
- The deduction related to export earnings.
Other changes to the US tax code were assessed on a high level as to their general directional impact.
We have also been asked to provide a list of policy options for consideration by the Canadian federal government in its quest to avoid negative ramifications of the US tax reform on the Canadian economy.
All dollar figures are in 2017 US dollars unless otherwise specified. Conversions have been made at the purchasing power parity (“PPP”) rate, which equalizes prices between two countries, thereby holding purchasing power constant. The 2017 Canadian exchange rate we have used is $1.25. Any “pre-reform” US tax rates in this report refer to 2017 US tax rates.
The key authors of this study are:
- Michael Dobner, National Leader, Economics Practice, PwC Canada
- Peter van Dijk, National Leader, Tax Policy, PwC Canada
- Gemma Stanton-Hagan, Senior Economist, PwC Canada
- Manpreet Kaur Juneja, Economist, PwC Canada
- Angelo Bertolas, Senior Tax Advisor, PwC Canada

Scope of review
To prepare this assessment, we have reviewed and, where appropriate, relied upon various documents and sources of information. By general classification, these sources include the following:
- IBIS
- Statistics Canada
- Bureau of Economic Analysis
- US Census Bureau
- US Energy Information Administration (“EIA”)
- Organization for Economic Cooperation and Development (“OECD”)
- World Bank
- Interviews with industry participants
- Academic research articles
- News articles
A full list of sources and articles used for the purpose of this assessment is available in Appendix A: References.

U.S. Tax Reform
In December 2017, the Tax Cuts and Jobs Act was signed into law in the United States (“US”). Its purpose was to stimulate investment in the US and incentivize US multinationals to repatriate income held abroad. In industries where Canada and the US compete for capital, the changes introduced by this reform may have an impact on the relative attractiveness of Canada and the US as alternative destinations for investment.
Prior to US tax reform, Canada’s statutory corporate tax rates were substantially lower than in the US, increasing Canada’s attractiveness to new investment. Due to the US tax reform, Canada’s tax advantage has been eliminated. Below we list the components of the US tax reform that are most likely to influence Canada’s competitiveness in attracting investment. A more detailed description is provided in Appendix C: US tax reform measures.
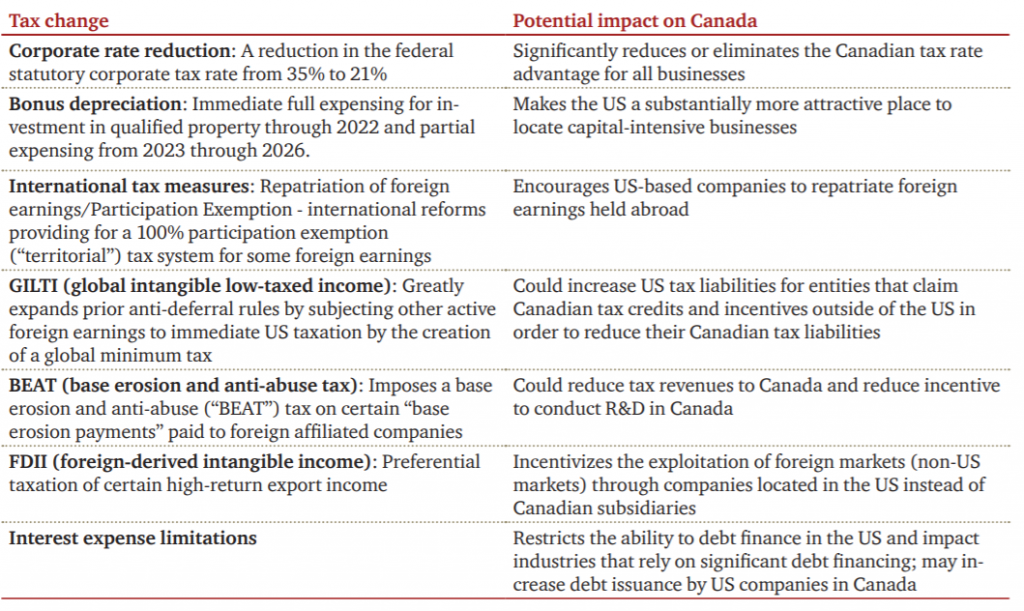
Other measures introduced through the US tax reform are likely to have a minor impact, if any, on Canada’s economy.

The State of Canadian Competitiveness
The following section reviews the state of Canada’s overall competitiveness in relation to the US. We first review overall rankings of national competitiveness and the reasons for Canada’s place in them. We then assess the factors contributing to individual companies’ investment decisions.
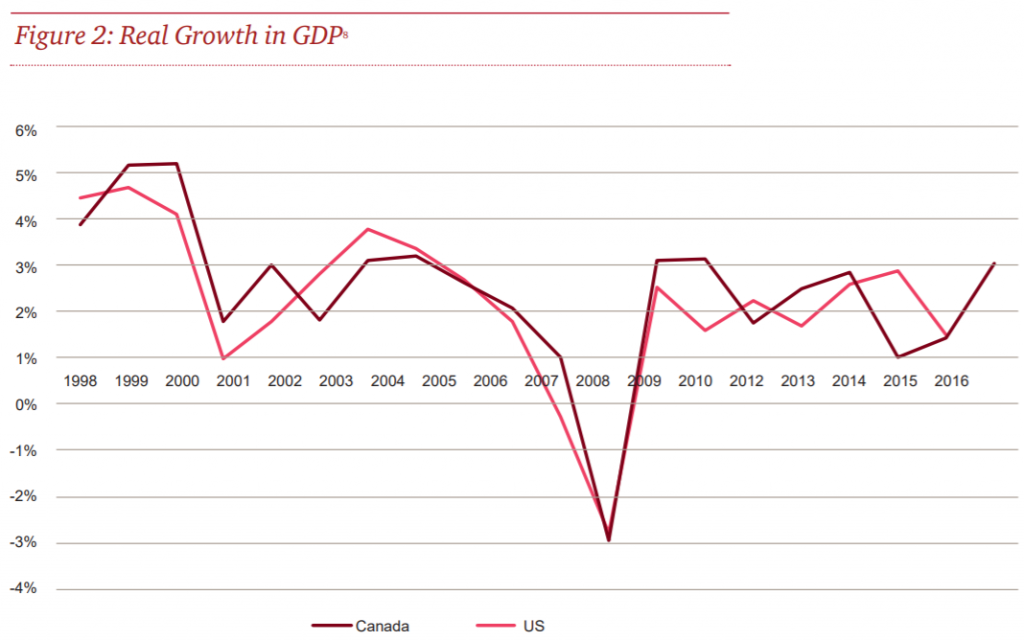
This report focuses on Canada’s investment competitiveness because Canada needs to compete with other countries for the capital investment necessary to create economic growth and jobs. It is important to note that prior to US tax reform, Canada had been lagging behind the US in terms of both business investment and economic growth for several years, as shown in Figure 1 and Figure 2.
Canada’s competitiveness in this report refers to its ability to attract new investment. In today’s global economy, Canada competes with the US and other jurisdictions for potential new investment in many industries.
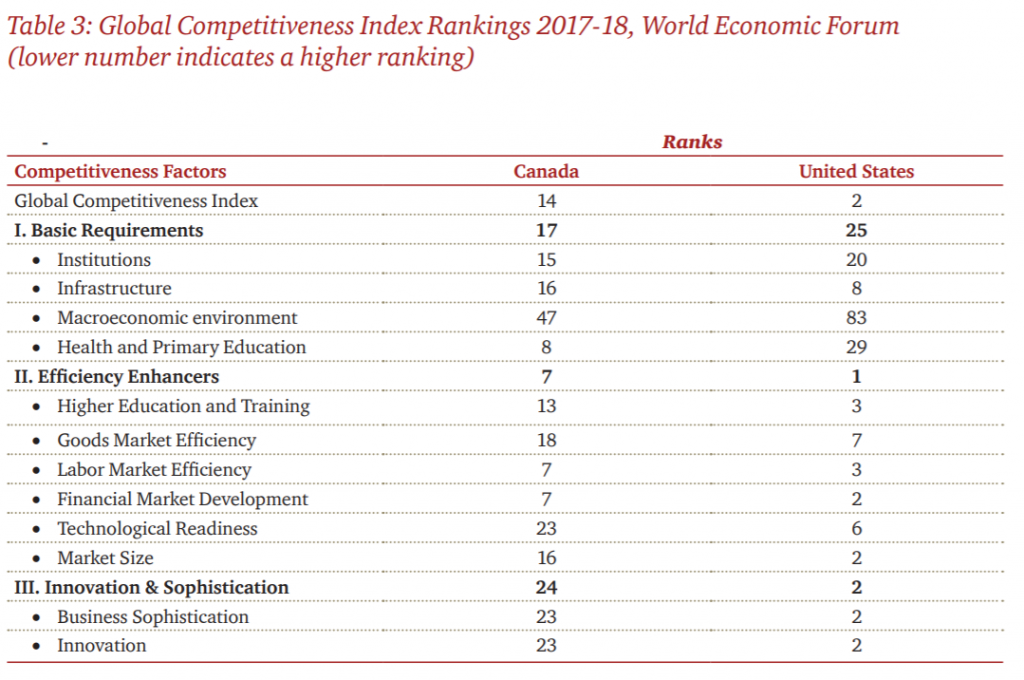
The Global Competitiveness Index published by the World Economic Forum ranks economies based on national competitiveness. In 2017—18, out of 137 economies, it ranked the US as the second most competitive nation while Canada was ranked 14th. The US’s ranking has improved from 7th in 2012 – 13 while Canada has remained stagnant at 14th.
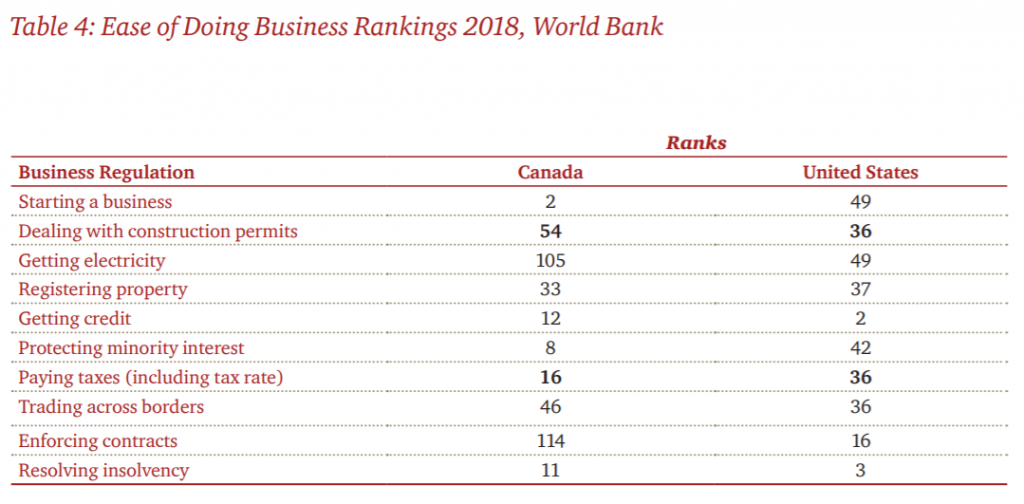
At a disaggregated level, this disparity in ranking reflects productivity differences in various factors summarized in Table 3. While Canada has higher competitiveness than the US for basic requirements, it lags behind on efficiency enhancing factors and innovation and sophistication. For total tax rate, a goods market efficiency enhancing factor, the US was ranked 95th in 2017 while Canada was 15th. The Executive Opinion Survey 2017 reported tax rates and tax regulations as the two most problematic factors for doing business in the US.

The International Tax Competitiveness Index (“ITCI”) measures two important aspects of a country’s tax system: competitiveness and neutrality. In 2017, out of 35 OECD countries, Canada was ranked 17th and the US 30th for international tax competitiveness.


As shown in the above tables, Canada’s corporate tax advantage relative to the US was a key factor in reducing the gap in competitiveness between the US and Canada. The US tax reform has eliminated this one important Canadian advantage.
The United Nations Conference on Trade and Development World Investment Report 2018 points out that about half of global foreign direct investment (“FDI”) stocks are either located in the US or owned by US multinational corporations (“MNCs”). The conference expects the US tax reform to significantly impact investment in the rest of the world. The US tax reform will increase post-tax return in the US relative to other countries, thereby making them less attractive to investment relative to the US. In particular, the tax exemption on repatriation could encourage US MNCs to repatriate more than $3.2 trillion of accumulated overseas retained-earnings to the US.
Investment decisions
In industries where Canada competes with the US for new investment, businesses carefully weigh the expected return on investment before deciding where to locate a new facility or expansion. Typically, this is done using a cash flow model. In most cases, the following considerations are important in these decisions:
- Market size and accessibility to customers. Large corporations are generally more productive than small and medium-sized businesses. Due to the larger size of the US market, the average size of firms in the US is larger compared to Canada. This factor is estimated to account for about 50% of the corresponding manufacturing productivity gap and 20% of the gap in sales per employee.
- Non-location sensitive costs. Some operating costs, such as raw materials, parts, sub-components, major plant and equipment, do not vary significantly by location. These tend to be governed by world market prices or are fixed at other levels of the supply chain.
- Location-sensitive costs:
- Labour costs, including salaries, employee benefits and statutory plans
- Facility costs, including land, construction, lease, rental costs
- Transportation costs
- Utility costs
- Cost of capital, including financing cost, depreciation charges
- Tax rates
- Incentives
- Regulatory costs
- Availability of key resources:
- Land
- Skilled labour
- Suppliers
Based on interviews with company executives, Canada’s relatively low corporate tax rate was an important element of Canada’s attractiveness for investment prior to the US tax reform. Therefore, considering the geographical proximity and overall competitiveness of the US economy, the US tax reform that eliminates a major advantage for Canadian businesses relative to US businesses may pose a significant risk for the Canadian economy.
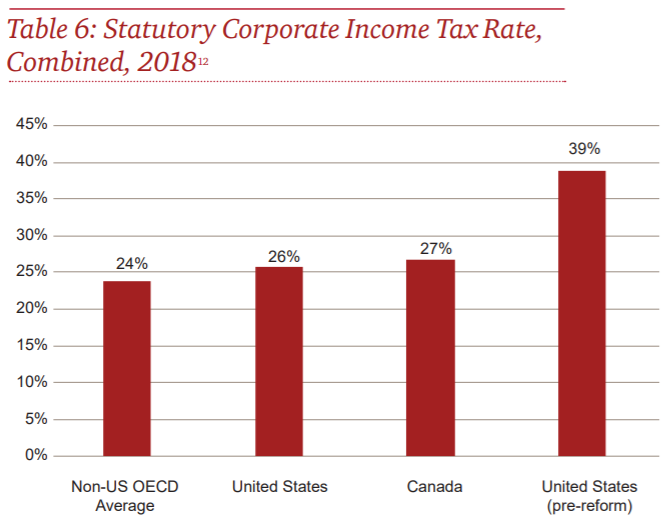
The chart below illustrates the combined national and sub-national statutory corporate income tax rate in Canada, the US (both pre- and post-tax reform) and the non-US OECD average. Canada’s rate is now above both the OECD average and the US rate, whereas previously the US rate was substantially higher.
NAFTA renegotiations and tariffs

As noted above, access to market is a key component of investment decisions, particularly in an increasingly globalized market. Currently, there are a number of potential changes to the North American trading environment. NAFTA renegotiations are ongoing, and the US has introduced tariffs of 25% and 10% on steel and aluminium, respectively. There is an ongoing section 232 investigation that could result in tariffs of up to 25% on Canadian auto and auto parts exports to the US. Above all, the uncertainty created by this kind of environment is detrimental to investment in Canada and is among the top concerns of companies we interviewed for this study. If these issues are not resolved favourably for Canada, they will act as another obstacle to the Canadian economy over and above the US tax reform. However, for the purposes of this study, we have assumed that all trade disputes between Canada and the US will be resolved with no significant negative impact to Canada.
Technology and new investment
The term “Industry 4.0” refers to the increasing digitization and automation in industrial production, and encompasses a wide range of changes to technology and process. Innovation and advances in technology will shape the economy of the future, while companies that fail to embrace these changes will fall behind.13 Therefore, these trends increase the importance of attracting new investment in the coming years. The impact will be especially large in manufacturing industries, which have the highest potential for digital transformation. This is expected to lead to a return of significant portion of production that was lost to developing countries in previous decades back to North America.
Figure 3 shows the level of digital maturity by industry. Automotive, electronics and industrial equipment are among the most digitally advanced industries globally.

Industry 4.0 affects new investment in the following ways:
- Creates a need for substantial new investment, even in mature industries where technology is employed to lower costs.
- Increases the capital intensity of new investment.
- Increases the importance of high-skilled labour.
As this report shows, US tax reform is expected to have a particularly large impact on capital-intensive industries, and may increase the “brain drain” of highly skilled workers from Canada to the US. Therefore, greater digitization exacerbates the threat to Canada posed by US tax reform not only in losing portions of its existing industries but also in foregoing the opportunity to “onshore” activity that has been outsourced to developing countries.
Impact of US tax reform on investment
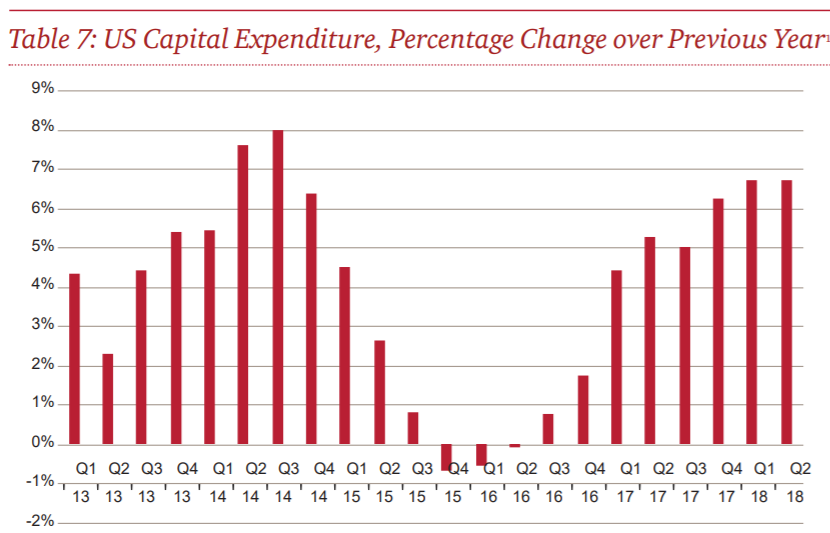
The following section reviews the literature on the impact of corporate income tax cuts on investment. Economists generally agree that a decrease in the effective corporate income tax rate will lead to an increase in investment, but not necessarily on the magnitude of the impact. Changes in the corporate tax rate influence investment through two channels. First, they increase the expected after-tax return on any future investment. This is the focus of the analysis in this report. Second, tax cuts increase companies’ cash flows by decreasing taxes on investments that they have already made.15 Recent data supports the idea that the tax cuts will encourage investment: a PwC survey of 20 US large-cap companies showed that 45% plan to increase investment, while another 45% plan to return money to shareholders and 10% plan more acquisitions. Capital expenditure of S&P 500 companies in the first quarter of 2018 was up 21% year-over-year, and represents the largest one-quarter increase in seven years. The table below shows the change in capital expenditure over the previous year by quarter. The first two quarters of 2018 following the US tax reform show strong growth compared to the previous three years.
A report by Bloomberg applied estimates from literature to the current US tax reforms and predicts an increase in investment of 6% for US corporations and 32% for US multinationals, based on temporary bonus depreciation and not including the macroeconomic impacts of deficit spending.

Cummins, Hassett and Hubbard looked at the impact of corporate tax cuts in the US in 1961, 1971, 1981 and 1986. They found that on average, all else being equal, a one percentage point decrease in the corporate tax rate increased capital investment by between 0.5% and 0.8%percentage points, and that the impacts were significantly larger for firms with no tax loss carry forwards. More recently, Lewellen and Lewellen used US data from 1971 to 2009, using lagged returns and lagged cash flow as instrumental variables to correct for bias in the data. They found that one dollar of current and prior year cash flow is associated with between $0.32 and $0.63 of investment for firms that were less borrowing constrained and more borrowing constrained, respectively. Djankov et al. looked at corporate tax rates across many countries and found that a 10 percentage point increase in corporate taxes was associated with aggregate investment that was two percentage points lower. Higher corporate tax rates were also associated with lower levels of FDI and entrepreneurship, and were found to impact manufacturing, but not services.
Ljunqvist and Smolyansky use a novel approach that takes advantage of spatial discontinuity in the tax rate between adjacent US counties using data from 1970 to 2010. They found that corporate tax cuts have no impact on economic activity unless they are implemented during a recession, in which case they significantly increase employment, and income.
Given the high level of globalization in the US, FDI is also important. Razin, Sadka, Desai and Swenson found that an increase in the corporate tax rate in the host country had a significant negative impact on FDI. An increase in the corporate tax rate in the source country had a positive effect, as we would expect to see when countries compete for capital investment.
Overall, the literature supports the idea that a decrease in corporate tax rates should increase investment, including FDI. However, the precise magnitude is not clear, and a number of factors such as loss carry-forwards at a given company, a lack of borrowing constraints, and an economic expansion could dampen the effects. Given Canada’s proximity to the US and high level of integration with the US economy, it is likely that an increase in investment in the US would likely come mainly at the expense of Canada.

Impacts of Deregulation
Along with tax reform, the current US administration has prioritized widespread deregulation. At the same time, the current Canadian government has introduced new regulations that will negatively affect energy consuming industries and resource extraction industries. While trends in regulation in both countries will likely impact investment decisions, detailed analysis of regulatory cost is outside of the scope of this report. Instead, regulatory issues that are likely to affect cost competitiveness are discussed on a case-by-case basis for each industry. The section below summarizes some key regulatory changes recently made in the US and Canada. We note that there may be negative long-term consequences of some deregulation that outweigh short-term cost savings. It is not our view that Canada should pursue a similar program of deregulation. However, regulation is an important component of attractiveness to investment, and recent changes are likely to have an impact.
In 2017, the US government issued 67 deregulatory actions, which the Office of Information and Regulatory Affairs estimates will save government agencies $570 million per year.25 Those most relevant to the industries studied in this report are regulations governing the environment and labour. On the environmental side, the Trump administration continues to work to repeal the Clean Power Plan, an Obama-era rule requiring coal-burning power plants to decrease carbon emissions. The US government is also revising the Obama-era expansion of the definition of “navigable waters” under the Clean Water Act, with the aim of decreasing protected waters. In the oil and gas industry, the government has proposed a revision to the Methane Rule, which regulates the waste of natural gas from venting, flaring, leaks, and emissions during oil and gas production. Additionally, there is a proposal to expand oil and gas drilling in the Outer Continental Shelf, which would allow drilling in more than 1 billion acres that were previously off-limits. On the labour side, the Trump administration has nullified a rule designed to improve federal contractor compliance with labour laws, and modified a rule requiring safety and health examinations of mines to be conducted before miners begin work. Anecdotally, we understand that these changes have encouraged investment in the US metals industry, but it will take many years to understand the full extent of their impact.
There have not been as many changes on the Canadian side. However, certain recent changes are likely to affect investment. The Canadian government recently introduced Bill C-69, which would change the approval process for mining and oil and gas projects. Once the bill is enacted in 2019, a government agency will review proposed projects’ environmental, health, social, and economic impacts over the long term. Critics say this will increase costs and uncertainty for resource companies. The Canadian government has also mandated that each province legislate either a carbon tax or cap-and-trade scheme in order to reduce carbon emissions. In addition to creating costs for companies, this policy has created uncertainty because some provinces are considering legal action to opt out of the program. Additionally, Ontario recently enacted major labour market reforms including raising the minimum wage, requiring that full-time and part-time workers be paid the same hourly wage, and increasing paid time off.

Approach and Methodology
The principal question that this report aims to answer is the potential impact of US tax reform on the Canadian economy. This study assesses three main impact channels:
- The direct impact of US tax reform on investments in Canada given the increase in US after-tax returns.
- The impact of US tax reform on the effectiveness of R&D incentives in Canada and its impact on R&D activity taking place in Canada.
- The impact of changes to personal income tax rates on Canada’s ability to attract and retain high-skills labour.
1. Direct impact on investment
A decrease in the corporate tax rate in the US, as well as other changes brought in by the Act, significantly increases the after-tax return on investment in the US relative to Canada. This is the main channel that our study investigates. Our approach to estimating this impact is on a sector-by-sector basis, and we used the following steps:
- Identified the Canadian sectors where investment is most likely to be directly affected by the US tax reform. Our approach to this step is described in the section on Affected Sectors.
- Assessed the trends in the Affected Sectors prior to the US tax reform and identified the key factors companies consider when deciding where to locate investment.
- Interviewed executives of key companies in each sector about their considerations when making investments.
- Gathered anecdotal information on shifts in investment that appear to be related to the US tax reform.
- Compared the effective average tax rates and effective marginal tax rates in relevant jurisdictions in Canada, and in the US pre-US tax reform, and post-US tax reform.
- Compared pre-tax profitability in relevant jurisdictions.
- Based on the above, concluded on the magnitude of likely direct impact on each sector.
- Based on the estimated impact, assigned an approximate share of the sector’s economic footprint that we predict will be at risk.
2. Impact on R&D incentives
Although the US tax reform has not immediately changed direct R&D incentives, the lowering of the corporate tax rate increases the effectiveness of existing US R&D credits. The Act also changes the way that foreign income of US companies is taxed through FDII and GILTI provisions, thereby changing the effectiveness of Canadian R&D credits for US-based companies. We assessed the impact of these changes through quantitative modelling of the R&D credits available on a certain investment in Canada and the US, both before and after US tax reform.
3. Personal income tax and the brain drain
In addition to changes to corporate income taxes, the US tax reform also lowers personal income tax rates and raised some bracket thresholds. This could have impacts on Canada’s ability to attract and retain high-skills labour, given the already large gap in after-tax income between Canada and the US in high-skilled occupations. We assess existing trends in competition for high-skilled labour and the relative attractiveness of Canada and the US. We then quantify the existing gap in after-tax income between the US and Canada and the increase in this gap caused by US tax reform, and conclude on the potential economic impacts.
Limitations
The following factors are out of the scope of this study:
- Changes to NAFTA and tariffs: We have assumed that all trade disputes between Canada and the US will be resolved with no significant incremental negative impact to Canada.
- Costing of regulations: We have not quantified the impact of recent and anticipated changes to regulation in the US and Canada, although we considered them qualitatively in our analysis.
- All measures included in the US tax reform including temporary measures such as bonus depreciation will remain in place for the foreseeable future.
- We have not taken into account any potential policy changes made by governments in Canada in response to the US tax reform.
- We have not considered the opportunity cost resulting from the potential for repatriation of sectors that do not currently have a substantial footprint in North America, because of technological advancements such as machine learning and artificial intelligence.
- The Canadian dollar will trade at its “fair economic value” as measured by the PPP rate.

Affected Sectors
This section describes our approach to identifying which sectors are likely to be most directly impacted by the US tax reform. The industries that we identified as likely to be directly impacted are assessed in the section on Impact of US tax reform on the competitiveness of Affected Sectors. We note that other sectors will be affected indirectly by a change in demand from directly affected sectors through the supply chain.
Our first step in identifying the Affected Sectors was to eliminate sectors that are local in nature and must serve their customers in the area of residence. In sectors where that is the case, Canada does not compete with the US for investment. We note that to the extent that these services are being outsourced, they are likely to be provided from a country with substantially lower-cost labour rather than the US. This criterion eliminated the following two-digit North American Industry Classification System (“NAICS”) categories:
- Utilities
- Construction
- Wholesale trade
- Retail trade (not including online retail trade)
- Transportation and warehousing
- Real estate, rental and leasing
- Management of companies and enterprises
- Administrative support, waste management and remediation services
- Educational services
- Health care and social assistance
- Arts, entertainment and recreation
- Accommodation and food services
- Other services (except public administration) that includes repair and maintenance, personal and laundry services, religious, grant-making, civic, professional and similar organizations, private households
- Public administration
- Professional, scientific and technical services that includes legal, accounting, tax, architectural, engineering, design, consulting, R&D, advertising, public relations and others, are local services mostly provided in the territory of demand.
In addition, we have excluded the financial and insurance industries because of regulatory barriers between the US and Canada and relatively low growth caused by saturation in the Canadian market.
After these eliminations, four two-digit NAICS categories remained:
- Agriculture, forestry, fishing and hunting (no industry included after further analysis explained below)
- Mining, quarrying, oil and gas extraction
- Manufacturing
- Information and cultural industries (included because of the high-tech industry)
In order to assess these industries, we analyzed the sub-sectors (three-digit NAICS) that comprise them using the following criteria:
- Canadian GDP greater than $10 billion CAD.
- Whether Canadian and US products are competing on North American or export markets.
- Profit margins: similar margins in Canada and the US suggest competitiveness.
- Presence of multinational companies: Their presence suggests that major players allocate investment internationally.
- Structural trends: We aimed to exclude industries that are not attracting new investment into Canada. Regardless of the US tax reform (e.g., coal mining), and those where there are regulatory or policy barriers to capital mobility (e.g., shipbuilding).
- Capital intensity: Those with high capital intensity are more likely to be impacted because of bonus depreciation.
The following sectors have a large footprint in trade and GDP, but were excluded because of secular trends that limit the potential impact of US tax reform:
- Petroleum and coal product manufacturing. By far the largest component of this industry is petroleum refineries, which are among the top exporters of Canada. However, only one new petroleum refinery has been built in the last 30 years, and some analysis suggests there is already overcapacity. It appears that US refineries are already more cost-effective even before the tax reforms. We note that if oil and gas production is negatively impacted, petroleum refining would also decrease.
- Crop production. This market is relatively less trade-reliant, as major companies in Canada have no presence in the US and imports are low.
- Wood product manufacturing. Estimates suggest that production capacity in British Columbia will be decreasing between now and 2020 because of limitations on wood supply. Recently there has been more investment in the US south because of greater wood supply, although Canada is still cost-competitive.
Based on the above criteria, we have defined the following sectors as likely to be directly affected by US tax reform (i.e. the Affected Sectors), in alphabetical order:
- Chemical manufacturing
- Food manufacturing
- High-tech
- Machinery manufacturing
- Mining
- Oil and gas extraction
- Plastic and rubber manufacturing
- Primary metal manufacturing
- Transportation equipment manufacturing
Some industries within these sectors are excluded, as described in the following sections.

Impact of US tax reform on the competitiveness of Affected Sectors
In this section, we present our findings regarding each of the Affected Sectors and the key industries within each.
The description of each sector is organized as follows:
- The sector in Canada: describes the activity in Canada and identifies key jurisdictions.
- The sector in the US: describes the activity in the US and identifies key jurisdictions.
- Investment trends: reviews recent trends in capital expenditure in Canada and the US.
- Key sector trends: identifies important drivers of activity and investment in the sector.
- Investment decisions: assesses which factors are important when deciding where to locate new investment.
- Rate of return: compares key jurisdictions in terms of pre-tax rate of return in order to assess the likely impact of tax changes.
- Tax impact and likely expectations: assesses the impact of tax reform on tax rates in the sector and concludes on the likely impact of tax reform. In that regard, we present the effective average tax rates and effective marginal tax rates in each sector. We note that the effective average tax rate shows the overall average rate a company would pay, and is most relevant for highly profitable companies when they are deciding where to locate a new investment. The marginal tax rate represents the tax paid on an additional dollar of profit, and is more relevant when deciding how large a given investment will be, or whether to expand on an existing site. We also present the effect on US tax rates under the assumption that marginal revenues are being generated through exports. In this regard, we take into account the FDII export-based credit. This analysis is relevant where a possible shift of revenues currently generated in Canada from domestic sources is shifted to the US and exported back into Canada.
- Conclusions and GDP impact: states our view of the likely impact of tax reform on the sector and identifies the share of the sector’s GDP, employment, and labour income footprint that we view as being at risk. Our methodology for assessing this impact is described in Appendix D: Input output methodology

Chemical manufacturing
Chemical manufacturers transform raw materials into consumer chemical products. The following are the three main activities within chemical manufacturing:
- Petrochemicals
- Pharmaceutical manufacturing
- Other chemical manufacturing including cosmetics, soap, adhesives, paint, fertilizer, synthetic fibres, and other chemicals
Our analysis focuses on petrochemicals and other chemicals. Pharmaceutical manufacturing has been excluded because new manufacturing capacity is not being added in Canada or the US, and this trend has not been affected by the US tax reform. However, new investments are being made in both petrochemicals and other chemicals, and the US and Canada are in competition for new capital investments. These two sub-sectors are discussed separately because different factors affect their competitiveness.

Chemical manufacturing in Canada
Petrochemical manufacturing transforms crude oil and natural gas into chemical products, which are then used to manufacture industrial and consumer goods. Ethylene and propylene account for 59% and 20% of Canadian petrochemical production respectively.
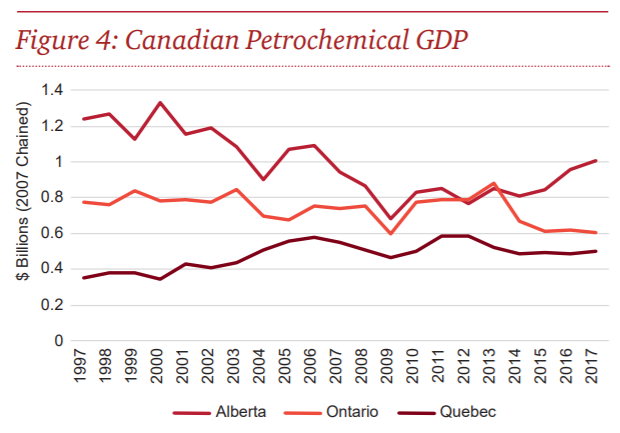
Petrochemical manufacturing occurs mainly in Alberta and Ontario with some activity in Quebec. In the past five years, GDP in Alberta has been on an upward trend, while in Ontario and Quebec it has remained approximately flat.

Although locations vary depending on the industry, most other chemical manufacturing is located in Ontario and Quebec. Unlike petrochemical manufacturing, these industries do not rely heavily on access to raw materials.
Chemical manufacturing in the U.S.
In the US, new investment in petrochemical manufacturing is occurring mainly in Texas and Louisiana. As in Canada, close proximity to raw materials (feedstock) is an important factor for competitiveness.
Other chemical manufacturing varies by industry, but primarily occurs in Texas, New York, California, and New Jersey.
Investment trends

Capital expenditure in chemical manufacturing in Canada has been steady since around 2011, with an uptick in expected 2018 capital expenditure driven by activity in Alberta and Ontario. Capital expenditure in chemical manufacturing in the US has been steadily increasing since 2011, and was over $45 billion USD in 2016. Between 2011 and 2016, investment in the US increased by 51% while investment in Canada increased 6%, suggesting that prior to US tax reform, Canada was already perceived by investors to be less competitive.
Although US data is only available up to 2016, research suggests that US capital expenditure in the petrochemicals industry continued on its trend of strong growth.
Key sector trends
Petrochemical manufacturing
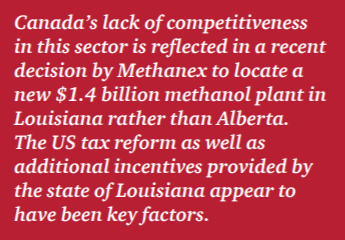
Currently, evidence suggests that prior to tax reform Canada was slightly less attractive than the US as a destination for new petrochemical facilities. Research by the Canadian Energy Research Institute (“CERI”) found that the cost of building a new petrochemical facility in Alberta or Ontario is significantly higher than the US Gulf Coast, taking incentives and rebates into account. A different CERI report looked specifically at methane-based petrochemicals and found that the internal rate of return (“IRR”) was higher in the US Gulf Coast than in Canada, and that tax reform would negatively impact this return across the board.
The relative attractiveness of the US is reflected in the fact that, capital expenditure in chemical manufacturing has decreased by 0.3% in Canada over the past five years, while increasing by 10.0% in the US. Below, we review the industry trends that have contributed to this situation.
Feedback prices
The main input into petrochemical manufacturing is feedstock, which is derived from either natural gas or crude oil. Therefore, the prices of natural gas and crude oil have a major impact on cost competitiveness. The majority of Canadian petrochemical manufacturing uses ethylene as feedstock, which is derived from natural gas liquids that are produced during natural gas processing. In Ontario, 40% of production uses benzene and toluene, which come from petroleum refineries. In contrast to Canada, more US facilities use naphtha as feedstock, which is derived from crude oil, meaning that US costs decrease when crude oil prices decline.
Since the shale revolution in the mid-2000s, natural gas prices in North America have remained below $4/btu (i.e. British thermal unit), compared to over $6/btu prior to 2009. Currently, natural gas prices in Canada are even lower, partially due to difficulty in getting natural gas to market. Canada’s only export market is the US, which also has plentiful low-cost natural gas. This dynamic is expected to change if proposed liquefied natural gas (“LNG”) facilities are built in British Columbia. Such facilities would enable Canadian producers to export to Asia. The proposed capacity for the planned initial facility is 3.23 billion cubic feet per day (“bcfd”), which amounts to 10% of global supply. Although such a facility would benefit natural gas producers, it would also raise the cost of feedstock for petrochemical producers. Several LNG facilities are also planned or under construction in the US, with export capacity expected to rise to 9.4 bfpd (i.e. barrels of fluid per day) by the end of 2019. While this will likely impact natural gas feedstock prices in the US, proposed export capacity as a share of production is significantly higher in Canada, meaning that natural gas prices will increase more for Canadian petrochemical producers compared to their American competitors.
Government support
Governments in both Canada and the US offer incentive programs for investment in petrochemicals. In Alberta, the Petrochemical Diversification Program has offered $500 million to companies opening new petrochemical facilities. Ontario also offers incentive programs to encourage new investment. In recent years, companies have not invested in new petrochemical facilities in Canada without government incentives.
In the US, Texas and Louisiana also offer incentive programs, such as the Texas Enterprise Fund and Chapter 313 of the tax code that offers tax breaks for investment that creates jobs.
Regualtion
Regulatory uncertainty and approval timelines can have an important influence on the economics of a project. A recent CERI study found that permitting timelines for petrochemical plants are twice as long in Alberta as in the US, and even longer in Ontario. In this industry, provinces and states have a relatively high degree of influence on permitting. In US Gulf Coast states like Texas and Louisiana, states have services available to streamline permitting processes and reduce uncertainty, making the regulatory environment more favourable to investors.
Exports
The market for petrochemicals in North America is now fairly saturated, and demand growth is being driven by Asian markets. This is a positive trend for North American producers, as increasing demand has allowed the industry to grow. However, it also means that access to these markets determines revenues. CERI analysis found that netback prices were higher in the US than in Canada because of Gulf Coast access to shipping terminals.
Other chemical manufacturing

As noted in the introduction to this section, the category we refer to as “other chemical manufacturing” is a composite of several smaller industries. These industries are cosmetics, soap, adhesives, paint, fertilizer, synthetic fibres, and other chemicals. For these industries, details of the cost competitiveness between Canada and the US are not available. In order to supplement this data, we have used information gathered from interviews with industry participants. Based on these interviews, we understand that prior to US tax reform, Canada and the US were roughly equally attractive to investment in other chemical manufacturing. This means that US tax reform could be a deciding factor in where to locate investment.
The following identifies key trends that are influencing competitiveness in the industry now and in the future.
Low growth
With few exceptions, growth in this industry is predicted to be fairly low, often less than 1% per year. Producers in Canada and the US are focused on the North American market, which is fairly mature and saturated. Therefore, volume is unlikely to drive future growth in the industry. Instead, companies will need to innovate in terms of product customization and lower costs. In 2017, the industry saw a high volume of M&A activity as a means to consolidate and drive growth. These trends are one reason for the focus on greater digitization and automation described below.
Industry 4.0
As in many manufacturing industries, future investments will be heavily influenced by a drive towards digitization and automation. A recent survey by PwC found that chemical manufacturing companies plan to invest 5% of annual revenue in digitization over the next five years, and almost one third say they are already at an advanced level of digitization. Interviews with industry members confirmed that chemical manufacturing companies operating in North America are actively piloting and developing advanced digital manufacturing facilities. In addition to the low-growth environment in the industry, labour markets are another issue driving automation. It is difficult for companies to hire reliable factory labour at low wages, and outsourcing to regions with lower labour cost represents a short-term gain. Automation provides an opportunity to “onshore” manufacturing and locate closer to customers and supply chains. It can also enable greater customization and more responsiveness to consumer preferences. In this way, companies can increase revenue while decreasing costs.
Other factors
- Government incentives. As in other manufacturing industries, many federal and state/provincial governments offer incentives for investment that creates new jobs. This can be a motivating factor in deciding where to locate investment.
- Proximity to markets. Chemical manufacturing in Canada and the US is focused on the North American markets. Proximity to customers lowers transportation costs and allows for more flexibility in meeting demand. Uncertainty around trade and tariffs in North America.
- Access to talent. Skilled labour is an important factor and will become even more crucial as automation and digitization increases. Currently manufacturing regions in both Canada and the US provide a good supply of skilled labour.
Investment decisions
The following outlines our understanding of the important factors when deciding where to locate a new chemical manufacturing plant:
- Feedstock availability and price. The price of feedstock and proximity to manufacturing facilities is the most important factor for petrochemical manufacturing. Feedstock accounts for around 70% of operating cost. In Canada this is largely driven by the price of natural gas, and in the US the price of crude oil is also a factor.
- Regulation and permitting timelines. Uncertainty, complexity, and length of permitting processes can influence the economics of a project. Canada has longer and more complex processes than the US Gulf Coast. In other chemical industries, greater harmonization between Canada and the US would support this export-intensive industry. Additionally, anecdotal evidence suggests that permitting timelines are longer in Canada.
- Access to market. Because most demand growth is coming from Asian markets, cost of transportation and time it takes to get to market are important. Currently the US Gulf Coast has an advantage over Canada because of its proximity to ports.
- Labour costs. Labour costs can also affect profitability, but not as much as feedstock. Shortages in skilled trades in Alberta, for example, can make it less attractive to investors.
- Access to skills. Skilled labour is very important to industry performance and is becoming more important as automation and digitization increase.
- Government incentives. As noted above, government incentives have influenced recent investment in both Canada and the US. Generally, incentives provided in the US are more generous.
- Taxes. Taxes could be a deciding factor in where new investment is located, especially given that Canada already has a disadvantage in terms of costs.
Tax impacts
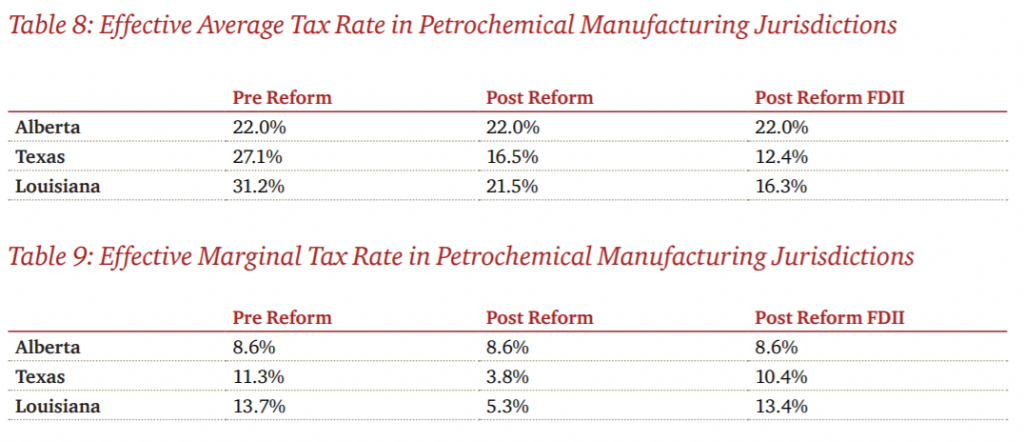
The figure and tables below presents the effective average tax rates and effective marginal tax rates in chemical manufacturing jurisdictions.
The jurisdictions included here are Alberta, Ontario, Texas (TX), Louisiana (LA) and California (CA). For more details on tax rate calculations, see Appendix B: Tax analysis methodology.

Petrochemical manufacturing
The following tables present the effective average tax rates and marginal average tax rates in petrochemical manufacturing jurisdictions.
Other manufacturing
The following tables present the effective average tax rates and effective marginal tax rates in the principal jurisdictions for other chemical manufacturing.
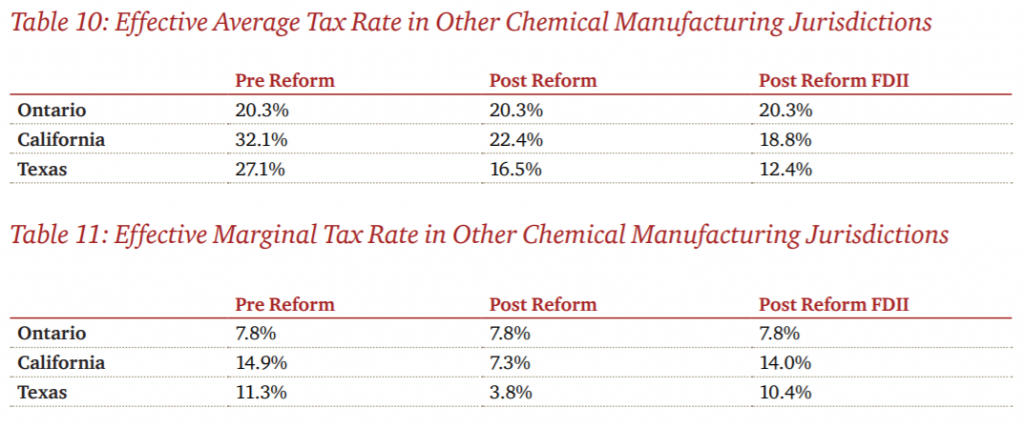
Rate of Return
In the petrochemical industry, our analysis suggests that Canada had a higher pre-tax rate of return prior to the US tax reform. Post-reform, Canada’s advantage in post-tax return is eliminated. As noted above, the potential development of a liquefied natural gas facility on Canada’s west coast creates a risk of increasing natural gas prices, thereby making Canada less competitive, as this is the primary input into Canada’s petrochemicals.
In the other chemical manufacturing industries, jurisdictions in Canada had a lower after-tax rate of return compared to California and Texas. The US advantage has increased significantly post-US tax reform.
Likely expectations
Taking all of the above into consideration, we are of the view that the US tax reform, all else being equal, poses a substantial risk to the long-term viability of all of Canada’s petrochemical industry and other chemical industry. In particular, we have developed the following likely expectations regarding the effects of the US tax reform on the chemical manufacturing industry in Canada:
- Methane and ethane-based petrochemical manufacturing is at a serious risk in Canada.
- There is potential planned investment of $20 billion CAD in Canada in the next few years, suggesting that there could be a major short-term impact if these projects are affected.
- Cost of construction of petrochemical facilities is higher in Canada.
- The building of an LNG facility could threaten Canada’s petrochemical competitiveness by raising the cost of natural gas, the key input in production.
The table below shows the portion of this sector that is “at risk” based on our assessment. These figures include the direct economic footprint of petrochemical and other chemical manufacturing industries in Canada, and the associated indirect, or upstream economic impact. We assess that a large portion of these industries will be at risk in the long term. We represent this view numerically by suggesting that 75% of the total economic footprint of these industries is at risk.


Food manufacturing
The food manufacturing sector produces food for human or animal consumption. The susceptibility of each type of food manufacturing to US tax reform will depend on the nature of their products. Typically, products with high value-to-weight and long shelf life are profitable to export, whereas other types of food are produced only for domestic consumption. For this reason, we have narrowed our analysis to the following industries:
- Flour milling
- Margarine and cooking oil processing
- Cereal production
- Chocolates, candy and ice-cream production
- Frozen food production
- Cookie, cracker, pasta, snack food production.
Together, the above categories account for approximately 20% of revenue.
We have excluded the following industries from our analysis:
- Production of dairy products and poultry processing: these are low value-to-weight products, and trade is closely regulated under supply management.
- Animal food and other (non-poultry) meat processing: these products are low value-to-weight and exports to the US are low.
- Seafood production: it is resource-bound in Atlantic Canada.
- Bread production: due to low shelf life, it is difficult to transport.
- Canned fruit and vegetable production: typically, the production needs to be close to farms.
Food manufacturing in Canada
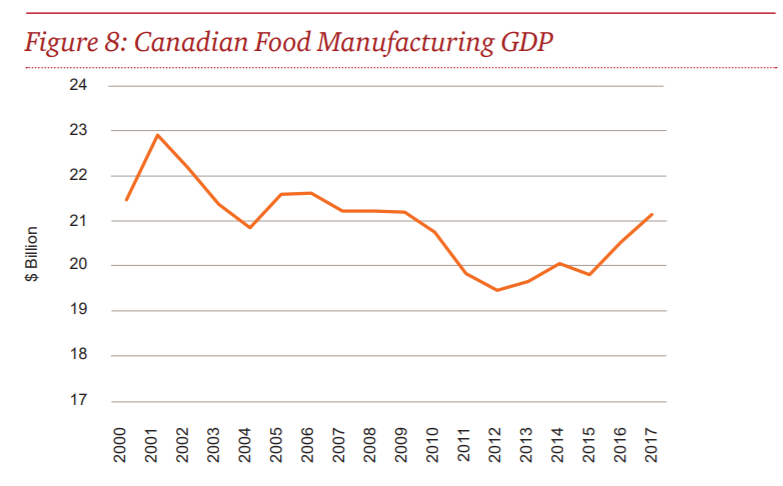
GDP in Canada’s food manufacturing industry has been increasing since a low in 2012. Ontario and Quebec are the centres of food manufacturing, accounting for 44% and 21%, respectively, of miscellaneous food manufacturing. They are followed by Saskatchewan, Alberta and British Columbia.
Food manufacturing in the U.S.
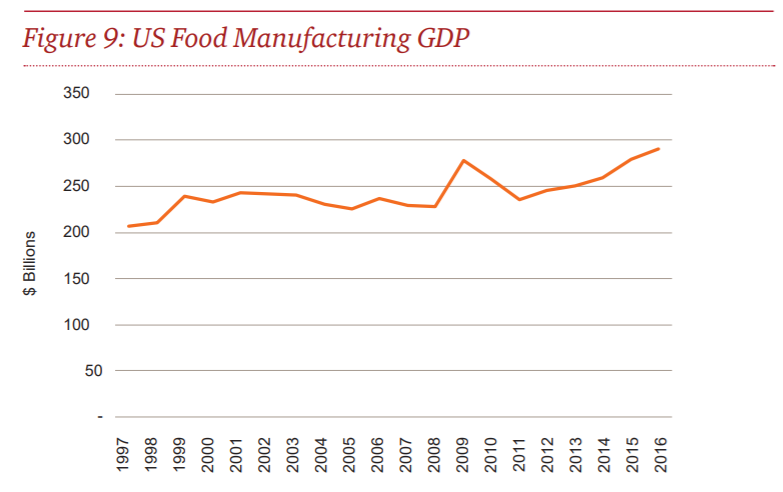
Food manufacturing represents a similar share of the overall economy in the US and Canada. In the US, foodmanufacturing GDP has been increasing steadily since 2011, showing a trend similar to that in Canada over this time. Food manufacturing facilities are concentrated in California, Texas, Illinois and Ohio.
Investment trends
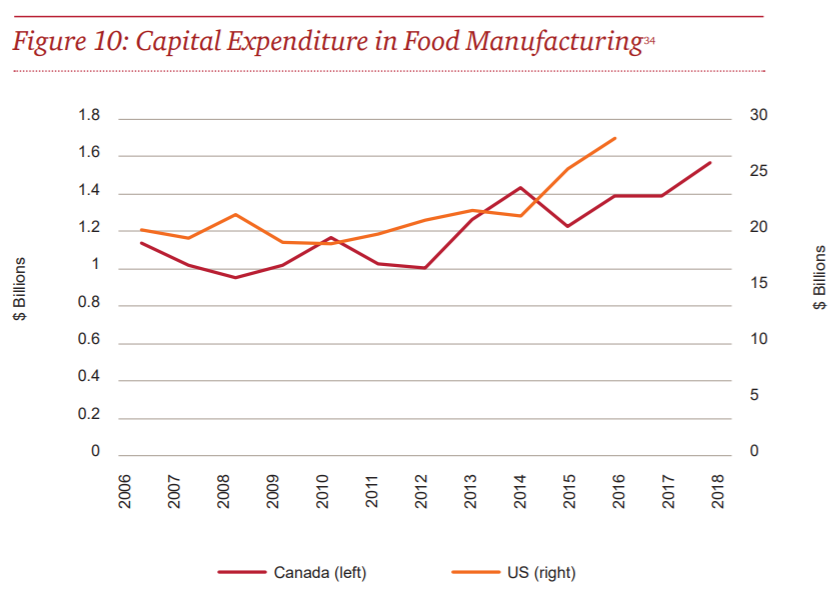
Since around 2010, capital expenditure in food manufacturing has been increasing both in the US and Canada. The data below includes the entire food manufacturing sector, so may not be representative of the industries we are focusing on in our analysis. Our research suggests that, US food manufacturing capex has continued to grow since 2016, although more slowly than in the past. The expected increase in planned investment from 2017 to 2018 is 2%.
Key sector trends
The following key industry trends are important for the long-term competitiveness in Canada and the US for food manufacturing facilities in the industries we have identified as vulnerable:
- There are two conflicting trends in food prices: i) downward pressure due to competition and ii) upward pressure as high-value added products and quality become increasingly important. Thus, the two key business strategy considerations are: i) product innovation and ii) cost containment.
- A key challenge is legal requirements regarding food safety, labelling and traceability, and other trade regulations.
- According to a survey, around 20% of industry participants believe that food production can be largely automated in 30 years. Therefore, this industry is likely to be affected by automation, but less so compared to other industries examined in this report.
Investment decisions
The following outlines our understanding of the important factors when deciding where to locate a new food manufacturing plant:
- Proximity to raw materials. This is the primary factor when considering a location for food processing facilities is proximity to market and raw materials.
- Access to market. Currently trade barriers are low within North America, meaning that export opportunities within North America are strong in both Canada and the US.
- Transportation cost. This sector also tends to be located in the most populous jurisdictions in both Canada and the US in order to minimize transportation costs.
- Labour cost. As in other manufacturing industries, labour cost is an important factor and has led to the consideration of automation opportunities.
Tax impacts
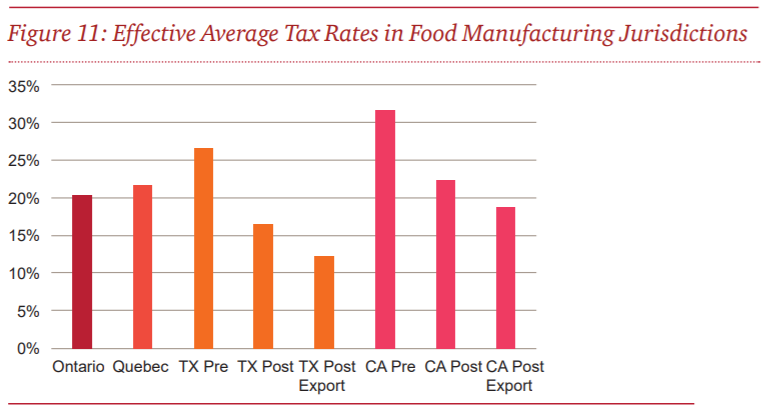
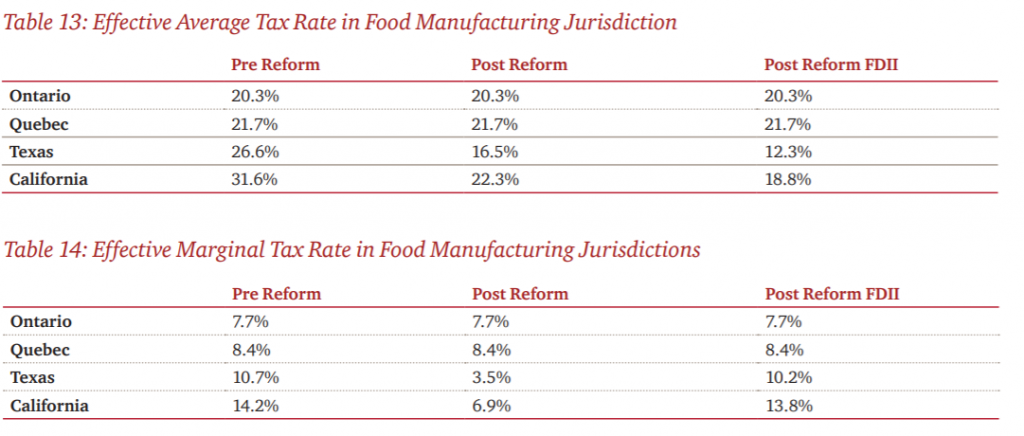
The following chart and tables present the effective average tax rates and effective marginal tax rates in food manufacturing jurisdictions.
The jurisdictions included here are Ontario, Quebec, Texas (TX), and California (CA). For more details on tax rate calculations, see Appendix B: Tax analysis methodology.
The following tables present the effective average tax rates and effective marginal tax rates in the principal jurisdictions for food manufacturing.
Rate of return
Based on our analysis, profits in food manufacturing industries we have studied are on average substantially higher in Canada than in the US; although the reasons for this are not entirely clear, this trend was stable over time. This is the case for all industries within food processing except for chocolates, candy and ice cream production and cookie, cracker and pasta manufacturing, where profits are similar between Canada and the US.
Likely expectations
Our view is that US tax reform will have a small negative impact on affected food manufacturing in the short term and a moderate negative impact in the long term. The reasons for this view are the following:
- Regulations in Canada are more stringent than in the US, making it less attractive to investors.
- Barriers to trade are very low, so US facilities can serve the North American market.
- High capital intensity means that immediate capital expensing is very beneficial.
- After tax return in Canada will continue for the most part be higher than in the US.
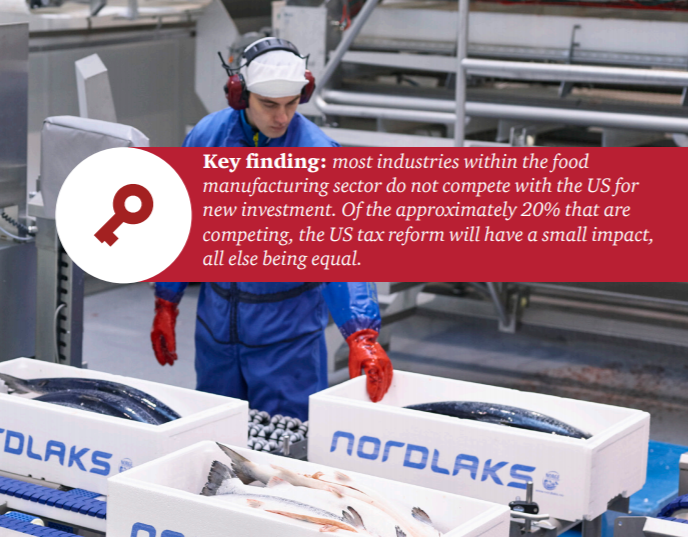
The table below shows the portion of this sector that is “at risk” based on our assessment. These figures include the direct economic impact of the food manufacturing sector in Canada and the associated indirect, or upstream economic impact. We assess that 80% of this sector is unlikely to be impacted by US tax reform because, as described above, these industries primarily serve the domestic market and it would not be practical to move facilities to the US. The remaining 20% is likely to experience a small negative impact. We represent this view numerically by suggesting that 2% (10%*20%) of the total food manufacturing economic footprint is at risk in the long term.


High-tech Industries
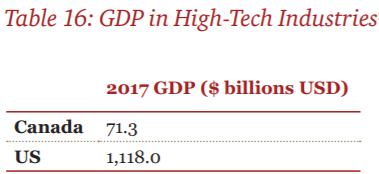
The high-tech industry is not identifiable using the NAICS codes that we have used for other industries. The OECD has estimated the GDP of the high-tech industry by aggregating ICT manufacturing, telecommunications, software publishing, and IT and other information services. The table below shows the estimated high-tech GDP in Canada and the US based on this definition.
The software industry is increasingly important in today’s digital economy and includes subsectors such as fintech, healthtech, internet of things, cloud computing, mobile, artificial intelligence, cybersecurity, and other areas of emerging technology. Telecommunications is also considered part of the high-tech sector because it is important in enabling digital technology. However, because of the increasing importance of digital technology, the high-tech industry permeates the whole economy including traditional industries such as financial services, retail, manufacturing, automotive, forestry, mining, and more.
This sector is also one of the fastest growing, and one of the most active investment targets worldwide. It is expected to be a key component of future productivity increases and growth as developed countries move towards serviceoriented high value-added economies.
One of the most important determinants of success for both small and established companies is access to talent. Globally there is a shortage of workers with the skills needed for this sector, and competition between companies is fierce. Top tech-job markets in North America include Toronto, New York, Seattle, Washington, and the Bay Area. Average salaries, cost of living, personal income tax rates, immigration policy, and career opportunities are all important determinants of access to talent for a given company.
Along with talent, a key element of success is the funding needed for rapid growth. Venture capital (“VC”) is the most important source of funding in this sector. Although US VC firms invest in Canada, firms located in the US find it easier to attract VC funding. Currently, Toronto, Montreal, Vancouver and Waterloo attract most of the VC funding in Canada. Each market has seen an increase between 106% and 672% in in total venture capital funding over the last eight quarters.

Small high-tech companies
Most companies in the high-tech sector are small: 86% of firms in this industry have fewer than 10 employees. Many startups do not have any revenue or profits, so tax is not a consideration in where to initially locate. The lower cost of rent and lower salaries may make it more attractive to initially locate in Canada. However, lower salaries along with relatively high personal income tax rate also make it difficult to attract and retain talent.
For small firms, funding from VC and private equity (“PE”) funds are important for growth. Small-scale companies are heavily dependent on US-based VC funds in particular. These firms would be hurt if US-based VC funds decided to reallocate investments toward the US and away from Canada. We spoke to several VC firms, and most were not planning to reallocate investment towards the US. One firm that was interviewed cited US tax reform as a minor factor. Notwithstanding, we note that there was a 7% decrease in total funding to Canadian venture-backed companies between the first and second quarters of 2018, but do not have evidence to suggest that this was linked to the US tax reform.
Large high-tech companies
Some Canadian tech companies have grown to be competitive on a global stage. However, it is generally the case that when a Canadian start-up grows to a revenue level that proves the viability of its concept, its operations substantially move to the US. This is due to greater access to VC funding and often the benefits that come with being part of a larger industry cluster such as the Bay Area. Taxes are also more likely to be a concern for companies with revenue levels that produce significant profits, but, as with small companies, access to capital and talent remain the most important determinants of success and hence location selection.
Many large US-based tech companies will set up a “backup” office in Canada, because of difficulty with the immigration status of workers hired from overseas. This suggests two things: that Canada’s immigration system is more conducive to hiring high-skills workers from abroad, and that this is not a barrier to US-based companies attracting these workers and eventually bringing them to the US.
Likely expectations
We are of the view that US tax reform will have a relatively small negative impact on the high-tech sector in the short and long term. The main reasons for this are the following:
- The most important factors for tech companies are access to talent and funding.
- Start-up companies are generally unprofitable and thus tax is not a consideration.
- Larger firms already tend to move to the US as they grow due to access to funding and talent.
- The US remains an attractive destination for tech companies that reach a certain size due to greater access to talent and funding.
- Some VC firms are re-allocating investments to the US for reasons that may include US tax reform.
- We note that decreases in US personal income tax rates have made it marginally easier for US companies to attract talent. We discuss this aspect in more detail later in the section on Impact on brain drain.
Due to lack of data availability for this industry, we have not quantified the economic impacts of negative effects on this sector caused by US tax reform.

Machinery Manufacturing
The machinery manufacturing sector includes a wide range of machinery that serves various other industries. Industries we have studied are mining, oil and gas machinery; pumps and compressors; tractors and agricultural machinery; construction machinery; plastics and rubber machinery; semiconductor machinery; heating and air conditioning equipment; metalworking machinery; printing, paper, food, textile and other machinery; engine and turbines; and wind turbines.

Machinery manufacturing in Canada
Machinery manufacturing in Canada mainly takes place in Ontario and Quebec, although some manufacturers are located closer to their downstream customers, such as oil and gas machinery in Alberta and agricultural machinery in Saskatchewan. The Canadian economy is specialized in machinery-intensive industries—agriculture, minerals, oil and gas, utilities, construction and manufacturing (“AMUCM”) account for approximately 30% of GDP and companies in these activities spend almost $41 billion on machinery and equipment. Canada is a net importer of machinery and equipment, and both imports and exports have been increasing since 2010.
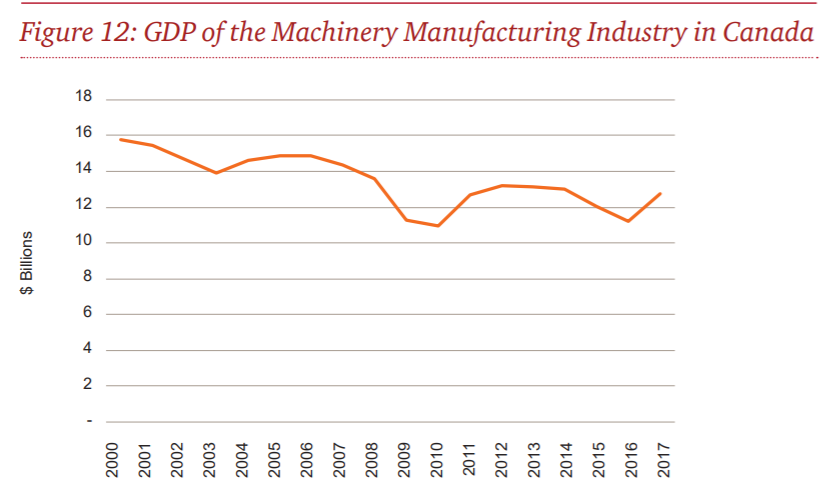
GDP in this sector declined from 2014 to 2016, increasing again in 2017. These movements are related to trends in the oil and gas industry, which is a major downstream consumer of machinery in Canada. Of all machinery manufacturing industries, oil and gas-related machinery posted the strongest growth in 2017.
Machinery manufacturing in the U.S.
Machinery manufacturing is one of the largest and most competitive sectors of the U.S. manufacturing economy. The competition is highly globalized, and international trade is large part of revenue of the machinery manufacturing in the US.
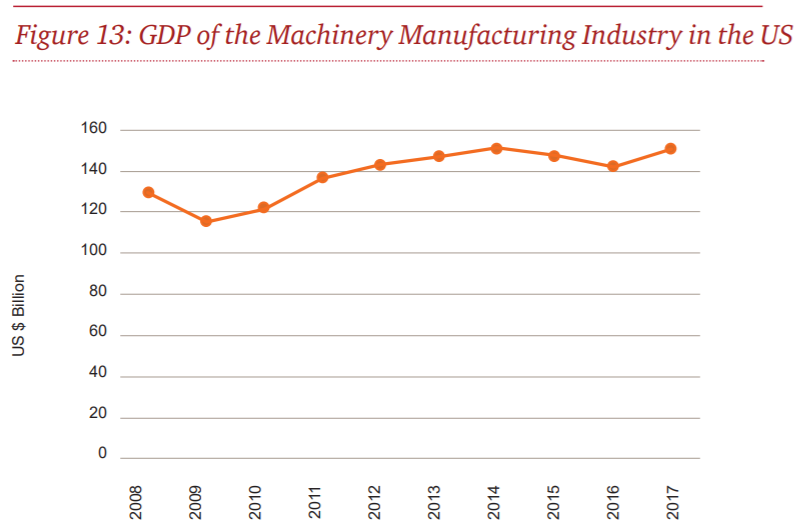
There is some machinery production in most states, but it is concentrated in the industrial Midwest, California and Texas. As in Canada, GDP increased in 2017, reversing the downward trend of the past few years.
Investment trends
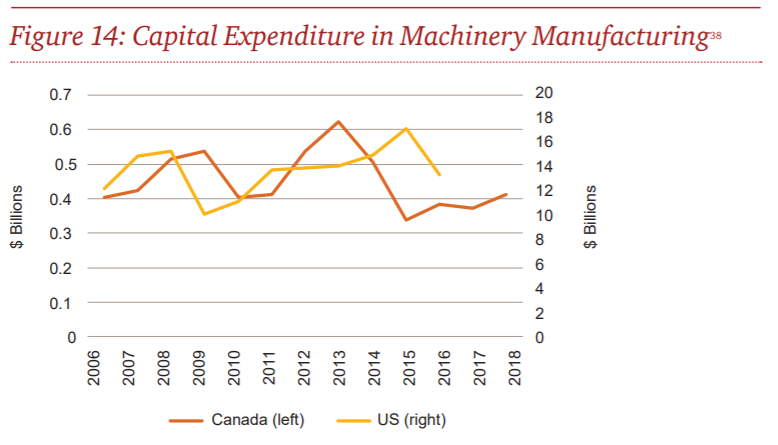
Capital expenditure in Canada has been declining since 2013. In the US, capital expenditure has also been decreasing even though GDP and exports have been increasing. This decline is likely related to the drop in oil prices and subsequent decrease in demand for oil and gas machinery.
Our research suggests that US capital expenditure has been increased modestly or remained flat since 2016, depending on the industry.
Key sector trends
The following section reviews key trends in the industry that are important to understanding the context of the impact of tax reform.
- The growth of demand in emerging markets. The clearest trend from the past decade is the growth of emerging economies both as consumers of manufactured goods and competitors or collaborators in producing them. This means that access to the international market is a crucial factor of firms’ competitiveness in this industry. Transportation infrastructure and trade policy can both have a major impact.
- Industry 4.0. Automation is increasing in the design, production, and marketing of manufactured goods. Industry 4.0 has the potential to dramatically reduce costs and improve productivity, but will require substantial additional capital investments. Firms expect to more than double their level of digitization by 2020 from 33% now to 72% by 2020.
- Downstream demand. Machinery manufacturing is highly fragmented, as demand for each type of machinery is determined primarily by its downstream use, which varies by type of machinery. For example, demand for oil and gas and mining machinery is closely linked to commodity cycles in those industries. Demand for wind turbine machinery is determined by overall trends in energy markets, and by government programs and incentives.
Investment decisions
From discussions with industry members, we understand that the following factors are important determinants of investment decisions.
- Access to market. Foreign markets are currently a major source of growth for the industry in Canada and the US. Therefore, access to the international market, such as low trade barriers and well-developed infrastructure, is a key determinant of firms’ investment decisions.
- Trade barriers. Currently Canada has an advantage due to lower trade barriers; Canada has a duty-free manufacturing tariff regime and is the first country in the G20 to offer a tariff-free zone for industrial manufacturers. In 2015, Canada implemented a major new initiative that reduced tariffs on all manufacturing inputs to zero, which will benefit machinery manufacturing by lowering the cost of imported inputs. On the other hand, the US recently raised tariffs on machinery components from China, a major supplier and consumer of the machinery manufacturing industry.
- Transportation. Canada and the US both have well-developed transportation infrastructure. According to the International Logistics Performance Index (“LPI”), Canada is ranked 17th best for logistics infrastructure, while the US is ranked 10th. However, in some cases international suppliers have been chosen over Ontario manufacturers in supplying machinery to Alberta due to lack of oversized load corridors.
- Cost factors. Access to labour and primary metal inputs, as well as the exchange rate, all contribute to overall competitiveness.
- Taxes. Given the trade-intensive nature of the industry and the similar cost structure in Canada and the US, taxes could be a deciding factor.
Tax impacts
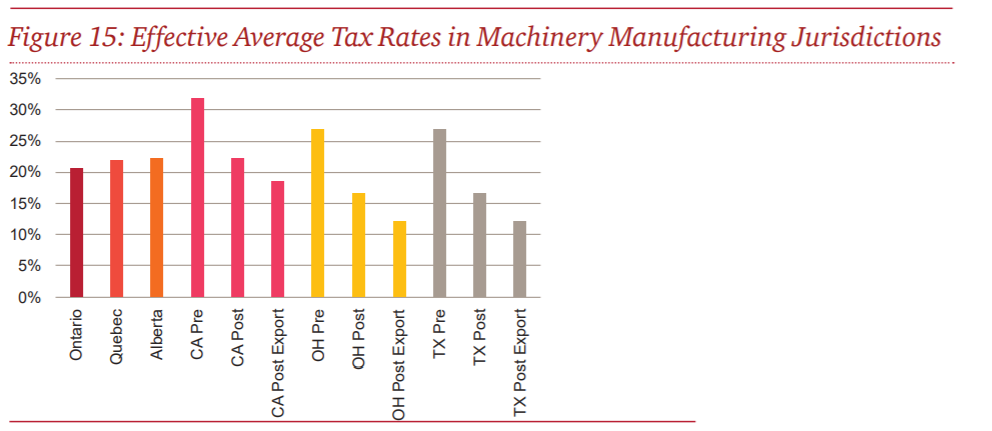
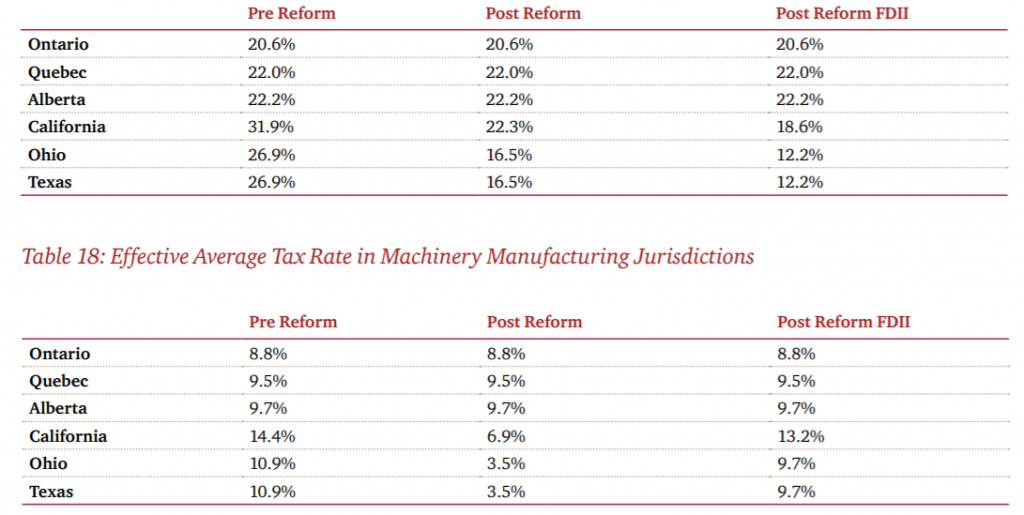
The following figure and tables present the effective average tax rates and effective marginal tax rates in machinery manufacturing jurisdictions.
The jurisdictions included here are Ontario, Quebec, Alberta, California (CA), Ohio, (OH), and Texas (TX). For more details on tax rate calculations, see Appendix B: Tax analysis methodology.
The following tables present the effective average tax rates and effective marginal tax rates in the main machinery manufacturing jurisdictions.
Rate of return
Overall, Canada and the US are currently fairly competitive. Our analysis suggests that with some exceptions, machinery manufacturing industries in Canada and the US have similar pre-tax rates of return. Prior to the US tax reform, after-tax return was higher in Canada. Post-US tax reform, with the exception of two industries, the US has a significantly higher after-tax rate of return. The two exceptions are tractor and agricultural equipment and pump and compressor manufacturing, which still enjoy higher rates of return postUS tax reform. These two industries account for 21% of revenue in the machinery manufacturing sector and 21% of exports.
Likely expectations
Taking all of the above into consideration, we are of the view that the US tax reform, all else being equal, will have a small negative impact on about 80% of the machinery manufacturing sector in the short term and a large negative impact in the long term. The reasons for this are the following:
- This industry is capital-intensive and will require additional capital investment as Industry 4.0 progresses.
- The rising trade barriers between the US and other countries may dampen the inflow of investment back to the US in the short term.
- The industry is export-intensive in both countries, and the North American market is highly integrated. Therefore, manufacturers located in either country could serve North American and international downstream industries such as agriculture, minerals, and oil and gas.
In summary, a combination of demand from downstream industries and relatively high market access could keep investment in Canada in the short term. In the long term, the US tax reform provides incentives for machinery manufacturers to relocate their investment to the US, and the overall impact will be significant if US barriers to trade are lowered.
The table below shows the portion of this sector that is “at risk” based on our assessment. These figures include the direct economic impact of machinery manufacturing sector in Canada, and the associated indirect, or upstream economic impact. The footprint below excludes the two industries that we have identified as not being at risk (tractor and agricultural equipment and pump and compressor manufacturing). Based on our analysis, a large portion of these industries will be at risk in the long term. We represent this view numerically by suggesting that 75% of the total machinery manufacturing economic footprint is at risk.

Green technology
The green technology sector includes all activities aimed at reducing carbon emissions and environmental impact such as renewable energy generation, storage and transmission, and efficiency-enhancing technologies. According to Statistics Canada, sales of this sector were $3.8 billion CAD in 2015. Green technology is a growing part of many sectors discussed in this report, such as environmentally friendly chemical manufacturing and electric vehicle
manufacturing.
While there is strong potential for growth in the green technology sector, in Canada this sector is still in early stages. According to a report by Analytica Advisors, R&D activity in the sector is strong, but businesses are having difficulty scaling. The authors also revised their expectations of the sector’s growth downward from previous years’ reports. The Canadian and provincial governments have offered support and incentives for green technologies. For example, in the 2017 budget, the federal government announced $2.3 billion in support for clean technology, which is available under a range of programs. However, we note that recently the Ontario government has withdrawn most of its support for this industry.
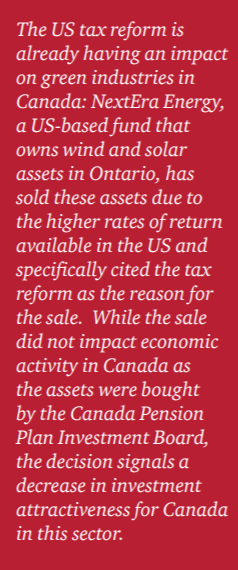
There is limited information on the competitive of Canada’s green technology sector relative to the US, as green technology is a part of many different sectors. One specifically “green” industry we assess is wind turbine manufacturing, which is a part of the machinery manufacturing sector. Our analysis suggests that a large part of this industry is at risk due to US tax reform. Generally speaking, we expect green technology, particularly those related to manufacturing, to be negatively impacted by the US tax reform.

Mining
The mining sector is engaged in extracting metals and minerals from the earth, and exploration to assess sites of future investment (junior mining). It includes coal, but not oil sands mining. Canada and the US are both top mining jurisdictions globally. In 2017, Canada attracted the highest share of global exploration investment at 14%, while the US was in third place with 7%. The mining industry is highly globalized, and typically large companies are engaged in exploration activities around the world. Other major mining regions include Australia, South America and China.
Both the US and Canada produce dozens of metals and minerals. However for the purposes of this report, we have narrowed our analysis to the metals and minerals that are significant to the US and Canada and for which the US and Canada are competing for capital investment. To do so, we applied the following criteria:
- Minerals that make a substantial contribution to GDP in both countries.
- Minerals that do not rely heavily on close proximity to markets.
- Minerals for which there is recent active exploration and development activity in both countries.
Based on these criteria, our analysis focused on two minerals: gold and copper. While stone, sand and gravel are important industries in both countries, very low levels are exported or imported due to high transportation cost.
As noted above, mining is a globally competitive industry. Mining companies looking to develop new resources have several potential projects at any one time, and assess the economics of each before deciding where to allocate capital.
Compared to other industries assessed in this report, two main factors differentiate the type of investments made in resource industries: the length of investment decisions, and the resource cycle. A new mine may produce for 20 or 30 years and will be an economic consideration for even longer due to reclamation activities. The mining industry is also highly influenced by global commodity prices, which tend to be cyclical. The industry recently recovered from a commodity price bust and is expected to continue growing for several years.

Mining in Canada
Mining directly accounts for 2% of Canada’s GDP and 19% of exports. Mining GDP in Canada was $26.3 billion in 2017, and has been on an upward trend since 2009. Over the past 20 years, Ontario has maintained the largest share of this GDP, although Quebec’s mining GDP is now growing at a faster pace. Other major mining jurisdictions include British Columbia, Saskatchewan, and Newfoundland.
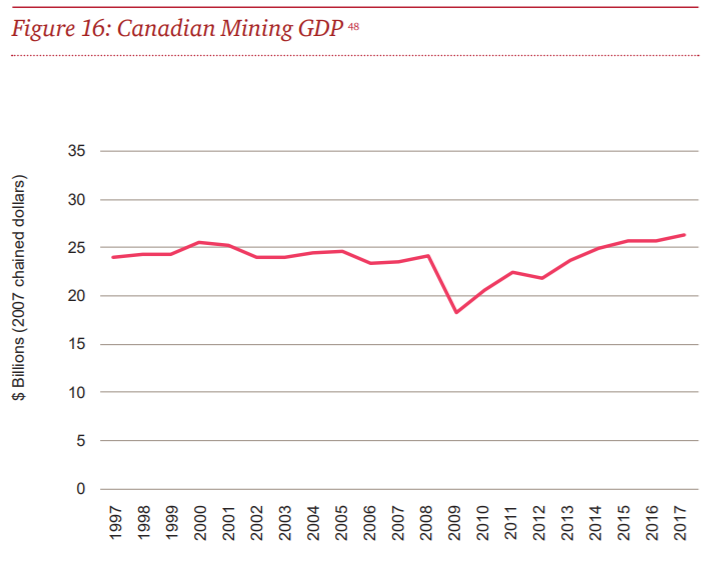
Gold
Gold is Canada’s top mineral product by value, worth over $8.3 billion in 2015. Canada is the world’s fifth largest gold producer. Canada is a net exporter of gold, and exports account for 57% of revenue. Within Canada, production is concentrated in Ontario and Quebec, with British Columbia and Nunavut representing a smaller share of output. Figure 17 shows gold and silver ore mining GDP, but this is representative of gold, which accounts for 96.8% of revenue from gold and silver mining. Downstream markets for gold in Canada are jewellers, investors, and industrial product manufacturers. Gold is considered a “safe haven” investment, and prices typically rise in times of geopolitical uncertainty, when investors are looking for secure assets.
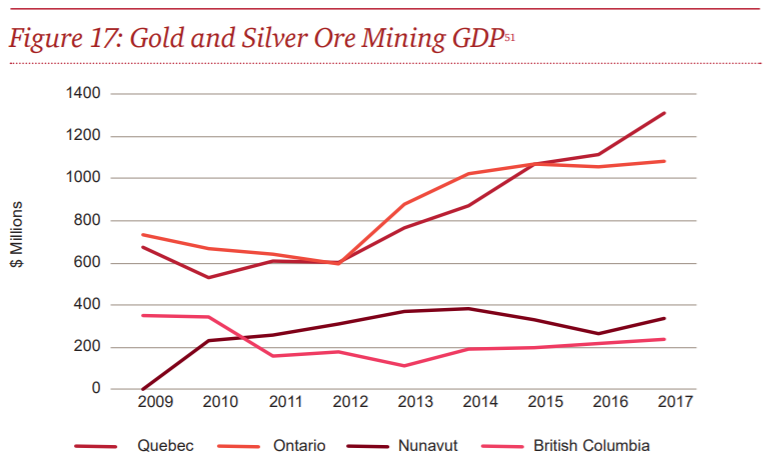
Copper
Copper is Canada’s third highest value mineral product, after gold and potash, with a 2016 value of $4.5 billion. Canada is among the world’s top 10 copper producers. In Canada, copper is usually mined alongside other minerals such as lead, zinc and gold. In the available data, copper is grouped with nickel, lead and zinc. Of this group, copper represents the
largest share of revenue at 54%.
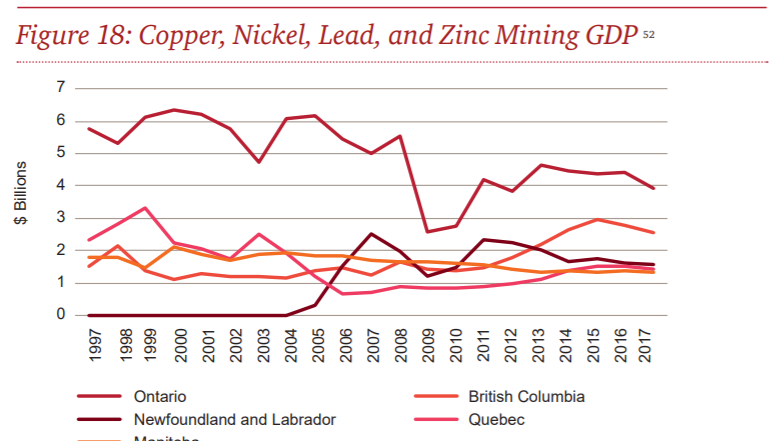
British Columbia and Ontario are Canada’s largest producers of copper, accounting for 49% and 29% of 2016 production, respectively.53 Canada is a net exporter of copper, and its largest export markets are the US and China. Uses include infrastructure, construction, manufacturing, and wiring and telecommunication. Urbanization in China and India has been driving export growth, but slowing growth in China may slow this trend.
Mining in the U.S.
Like Canada, the US is a major player in the global mining industry. The five states with the highest value of mineral production are Nevada, Arizona, Texas, Alaska, and California.
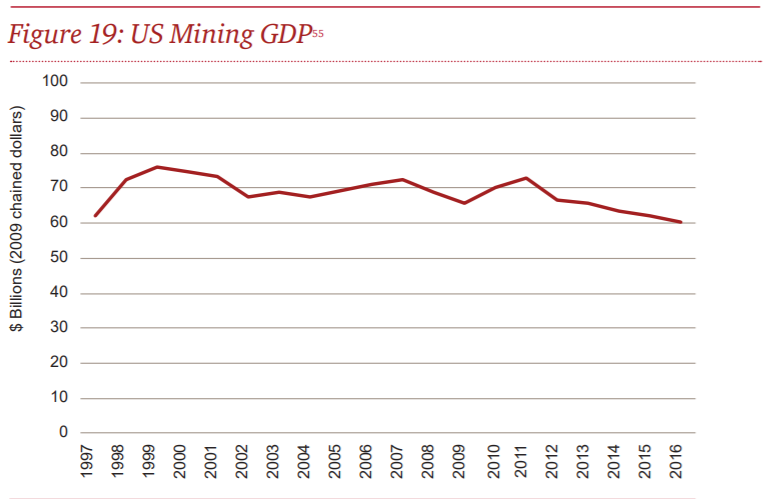
Gold
The US is the world’s fourth largest producer of gold, ahead of Canada in fifth place. Gold produces the second highest value of any mineral in the US, after crushed stone. US gold production in 2017 was 245 tons, a 10% increase over 2016. Nevada accounts for almost two thirds of US gold production. Other major gold producing states include Alaska, Utah and Colorado. The US imports gold from several countries including Canada, but is a net exporter. Downstream uses for gold in the US include jewellery, consumer electronics and coins.
Copper
The US is the world’s fourth largest producer of copper, and copper is the fourth highest value mineral produced in the US. US production of copper in 2017 was 1.27 million tons, an 11% decrease from 2016. Reasons for the decrease include low grades, lower mining rates, and various disruptions. The US is a net importer of copper, with imports satisfying 33% of domestic demand. Downstream uses of copper and copper alloys in the US are construction, electrical and electronic components, and transportation.
Investment trends
Prior to the US tax reform, US capital expenditure had been trending downward since a peak in 2014. This drop coincided with a decrease in the prices of many minerals and mirrors a similar decline in Canada. However, we note that this is a national figure and therefore does not necessarily represent the trend in every state or every mineral commodity. Our research suggests that in many areas including gold and copper, the US continues to attract investment.
Canada has seen a similar downward trend also due to a bust in commodity prices. However, we note that the sharpest decrease was in Saskatchewan, which is out of scope of our analysis as its mining production is mainly in potash where Canada does not compete with the US.
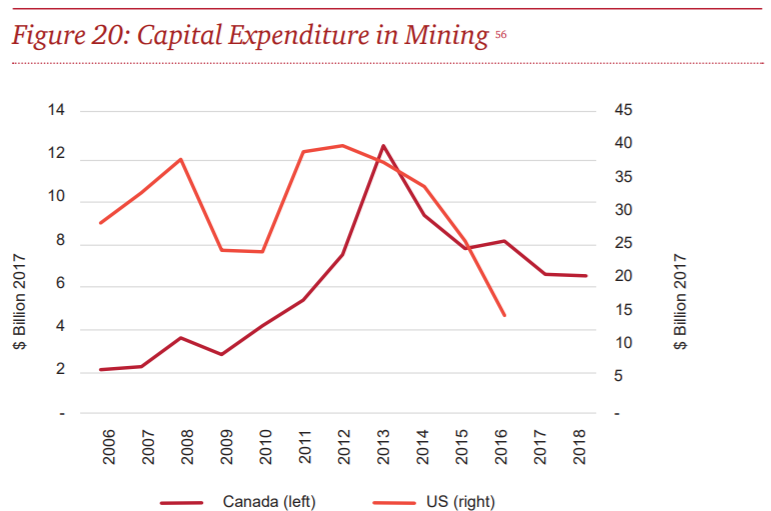
Key sector trends
The following section outlines key industry trends that were occurring before US tax reform, focusing specifically on gold and copper, as those are the minerals selected for comparison.
Decreasing investment
It is important to note that prior to US tax reform, there was a downward trend in capital investment in both Canada and the US. Capital expenditure has been decreasing in Canada since 2012 and in the US since 2014. There are several reasons for this trend:
- Low commodity prices. With lower prices, miners have looked to lower prices and consolidate assets rather than spend on exploration.
- Regulatory changes. Over this time, regulation in both Canada and the US has been cited as a challenge for miners.
- Infrastructure. As the mining industry in both countries is mature, resources are often located in remote areas that require extra planning for transportation and power.
Global markets
A key characteristic of resource industries is their cyclical nature. Investment in both Canada and the US is highly influenced by global commodity prices. Currently, the commodity cycle is in an upward swing after prices dropped in the early 2010s. During this time, companies have focused on consolidating non-core assets and lowering costs, and undertaken less exploration and acquisition. This is one major reason for the decrease in mining capital expenditure seen in both Canada and the US over the past five years. When mining companies do look to expand their operations, they have been more conservative than in the past. For example, new investments are focusing more on expanding existing sites rather than a greenfield investment.
In copper markets, demand is expected to increase moderately in the coming years. The current global oversupply is expected to decline, thereby pushing up prices. Growth in economic activity and the number of new infrastructure projects in China and India have been an important driver of global demand for copper, as it a key construction material. Although urbanization in emerging economies will continue to be an important factor, growth in these areas is expected to slow. Finally, the trend toward green technology will increase demand for a range of minerals, including copper. Copper is used to manufacture wind turbines, and some types of solar panels.
Although gold remains a core commodity for both Canada and the US, the outlook is somewhat less optimistic. World supply of gold is increasing, and recent years have seen lower exploration and development in Canada and the US. IBIS projections predict annual growth of 0.1% and -1.4% in Canada and the US, respectively. We note that despite these outlooks, there is active exploration and development of gold resources, as new resources will need to come online to maintain current levels of production.
Regulation and tax changes
This section reviews existing trends in regulation and tax that are currently affecting the competitiveness of the mining industry in Canada and the US.
- Tax
- In 2013, Canada phased out accelerated capital cost allowance for miners and eligibility of pre-production expenses
for Canadian exploration expense deductions. - Because US companies were eligible for a depletion deduction of between 5% and 22% prior to the US tax
reform, these companies generally faced lower effective tax rates coming into the US tax reform than Canadian
mining companies.
- In 2013, Canada phased out accelerated capital cost allowance for miners and eligibility of pre-production expenses
- Regulation
- Canada’s Bill C-69 will modify the project approval process for mining companies, which critics say will increase
timelines and uncertainty. - Canadian companies must comply with federal climate change regulations, increasing cost and uncertainty.
- Under the current US administration, there has been largescale deregulation, much of which would lower costs for
mining companies. Anecdotally, this has improved the attitude of mining companies towards investment in the US.
- Canada’s Bill C-69 will modify the project approval process for mining companies, which critics say will increase
Investment decisions
There are three main factors that mining companies consider when deciding where to invest in a mining resource. The first and most important is resource quality. A favourable policy environment cannot compensate for low quality resources. Next, companies consider where a resource is located. Sites in remote regions will have higher costs of transportation for machinery and equipment and extracted resources. Additionally, remoteness increases the cost of labour. In cold climates such as Alaska and Canada’s North, exploration and development may be possible only in some parts of the year. Next, the tax and policy environment comes into play. Taxes, permitting timelines, environmental regulations, and land rights are all important factors in determining where investment will take place.
Mining is a global industry, and companies typically consider potential sites in a range of countries. Investment decisions are then made based on the expected net present value of development of a new site, which is influenced by the factors above. If two jurisdictions have high quality ore resources, policy factors could determine where investment is made.
For minerals in which Canada has a strong natural advantage in resources, such as potash and uranium, we do not expect that US tax reform will affect investment. However, for gold, copper and other minerals in which both countries have high quality ore resources, US tax reform could potentially affect investment decisions.
The Fraser Institute’s annual survey of mining companies ranks jurisdictions on two indices: the Best Practices Potential Mineral Index, which measures raw resource potential, and the Policy Perception Index, which measures how mining companies perceive the policy environment in each jurisdiction. These are listed for the principal jurisdictions in which
gold and copper are produced in Canada and the US.

In jurisdictions where Canada and the US are competing, the measure of raw resource potential is similar. All six jurisdictions compared here are in the global top 25 and have been close to these positions for the past five years. On policy, the rankings of US states are higher overall. We note that this survey was completed in 2017 prior to tax reform, but taking into account expectations from the new US government. According to the index, the above-noted three US states are the most attractive in the US for mining. In particular, Nevada is a very attractive jurisdiction for gold mining, which could be a threat to Canada as it is our highest-value mineral commodity.
Policy issues cited by survey respondents included legal and regulatory uncertainty around land rights in British Columbia and high electricity cost and uncertainty around the Ring of Fire in Ontario.
Investments that are already underway are unlikely to be affected by US tax reform. However, future decisions about where to locate a new mine could be affected, as the change in tax rates is material. One mining company noted that the net present value (“NPV”) of a planned copper project had increased by 12% above the NPV calculated prior to the US tax reform.
Tax impacts
The following chart and tables present the effective average tax rates and effective marginal tax rates in mining jurisdictions.
The jurisdictions included here are Ontario, Quebec, British Columbia (BC), Alaska (AK), Arizona (AZ), and Nevada (NV) For more details on tax rate calculations, see Appendix B: Tax analysis methodology
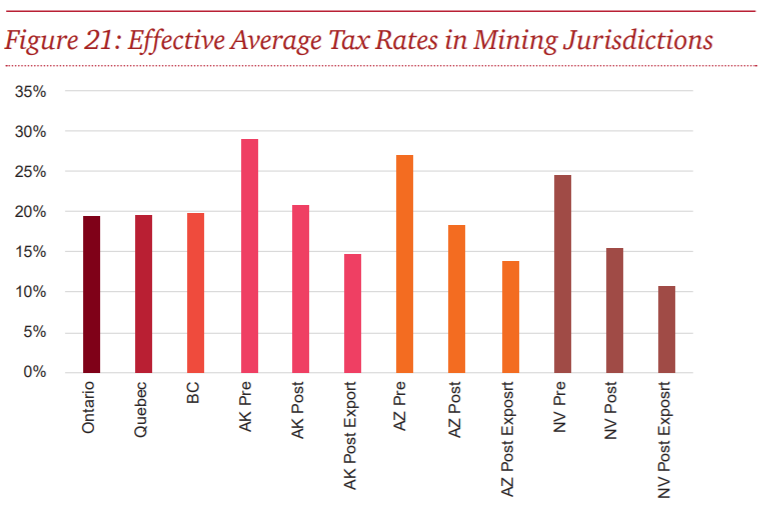
The following tables present the effective average tax rates and marginal effective tax rates in the main mining jurisdictions. We note that these rates do not include royalties.
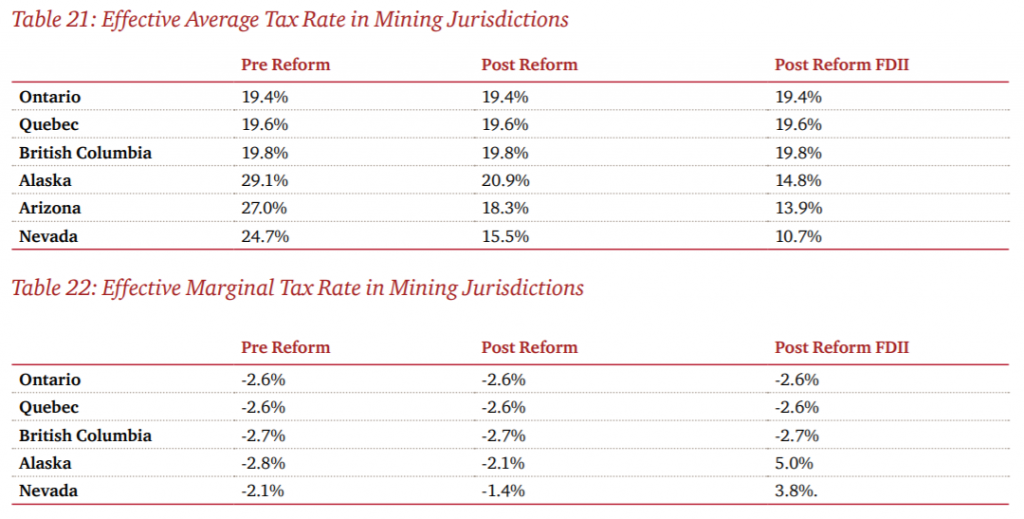
Rate of return
Rate of return in the mining sector is volatile and can change significantly from one year to the next. Based on our analysis, over the past five years pre-tax rates of return in gold and copper mining were somewhat higher in the US compared to Canada, but the after-tax rate of return in Canada was somewhat higher. The US tax reform has lowered effective average tax rates significantly, making mining in the US more attractive.
Likely expectations
Taking all of the above into consideration, we are of the view that US tax reform, all else being equal, will have a small negative impact on mining in the short and long term. The reasons for this are the following:
- Minerals in which the US does not have high quality resources are unlikely to be affected by US tax reform.
- Projects currently under development are unlikely to be affected by US tax reform.
- Investments in mining are very long-term, so the majority of existing GDP footprint is unlikely to be impacted in the foreseeable future.
- Future investment in minerals where both the US and Canada have high quality resources such as gold and copper could be impacted by US tax reform.
- However, each project is different and despite the tax disadvantage it could still be profitable to explore and develop resources in Canada.
The table below shows the portion of this sector that is “at risk” based on our assessment. This includes the direct economic impact of the mining sector in Canada and the associated indirect, or upstream economic impact. Based on our analysis, a small portion of gold and copper mining activity is at risk in the long term. We represent this view numerically by suggesting that 10% of the economic footprint of these industries is at risk.


Oil and Gas Extraction
The main activities in the oil and gas industry are extraction of crude oil, extraction of natural gas, and exploration. It is important to note that unlike manufacturing industries, an investment made in Canada would likely be quite different from one made in the US. The nature of investment in Canada differs from that in the US in terms of scale, production and timeline of projects. Even within a certain jurisdiction, differing geologies can substantially influence the cost of development and production levels.
This section deals only with oil and gas extraction, and excludes related industries such as oil refining, petrochemical production, and support services.

Oil and gas extraction in Canada
Canada has the third largest oil reserves in the world, and is the world’s third largest exporter. In natural gas, Canada has 1% of world reserves, and is the fifth-largest producer. In 2017, the oil and gas industry accounted for $92.9 billion dollars of revenue, of which 84% was generated through exports. Crude oil accounted for 59% of this revenue, while natural gas accounted for 41%. In 2017, the oil and gas industry accounted for 6.5% of Canada’s GDP and 14% of exports. The majority of Canada’s oil and gas activity takes place in Alberta. An estimated 96% of the oil that can be extracted economically is located in Alberta’s oil sands. Currently, 78% of Canada’s oil and gas GDP is generated in Alberta, the highest share since 2000.
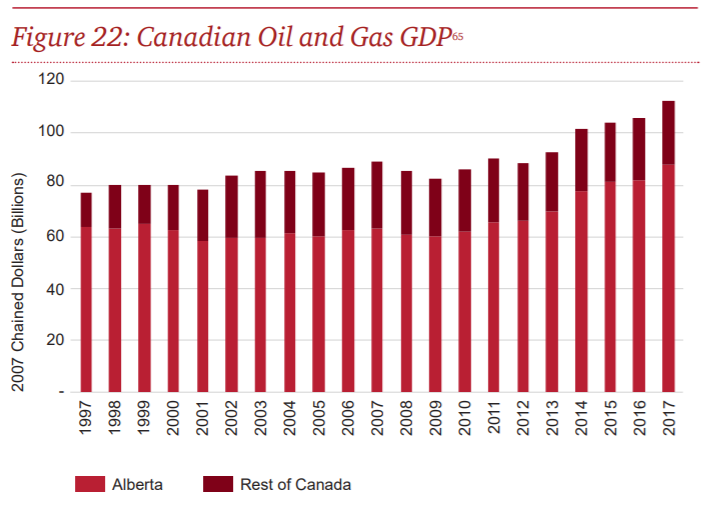
Oil and gas extraction in the U.S.
Annual oil and gas revenue in the US is more than twice that in Canada at $255.7 billion. Exports account for 9.5% of this revenue. US reserves of crude oil are estimated at 35 billion barrels, compared to 171 billion barrels in Canada. However, US has larger natural gas reserves, with 322 trillion cubic feet compared to 77 trillion in Canada. Between 2014 and 2016, oil and gas GDP in all states dropped, mirroring the trend in Canada as global oil prices fell substantially. Overall, US oil and gas production is concentrated in Texas, which in 2016 accounted for 55% of the industry’s GDP.
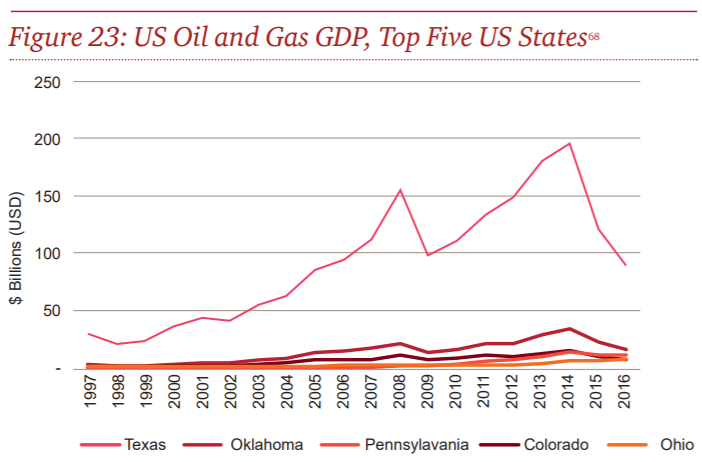
Figure 24 shows natural gas production for the top five US states based on 2016 production. These five states represent 88% of total production. Texas and Pennsylvania have the highest levels of production, and Pennsylvania’s is growing the fastest.
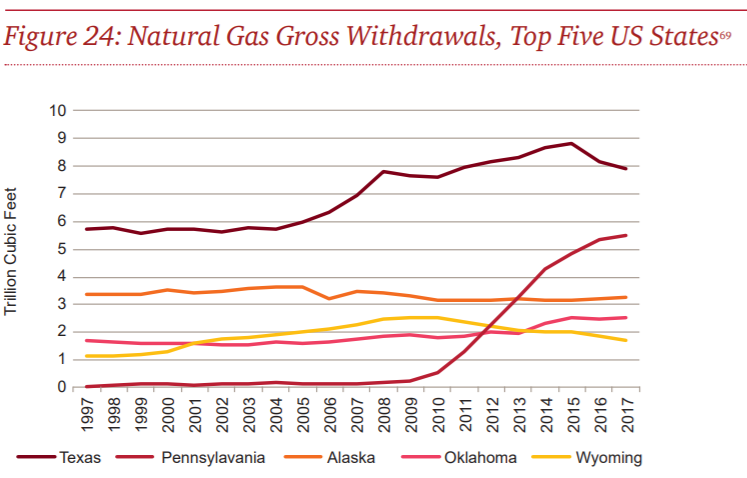
Figure 25 shows crude oil production in the top five US states by 2017 production. Together, these five states represented 85% of total US crude oil production. Of the five, Texas and North Dakota are the highest producing and fastest growing states. There was an uptick in production in 2017, particularly in Texas, suggesting that a recovery is underway.
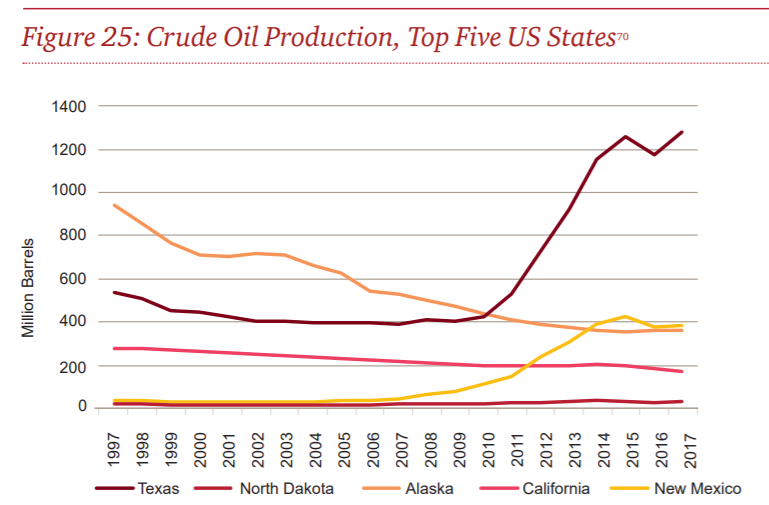
Investment trends
Between 2014 and 2016, capital expenditure in oil and gas decreased substantially in both the US and Canada. Several factors contributed to declining investment in the past four years including global oil prices, regulation and the “shale boom” in the US. In Canada, international companies have been leaving the oil sands, while Canadian players have bought them out and focused on managing costs.
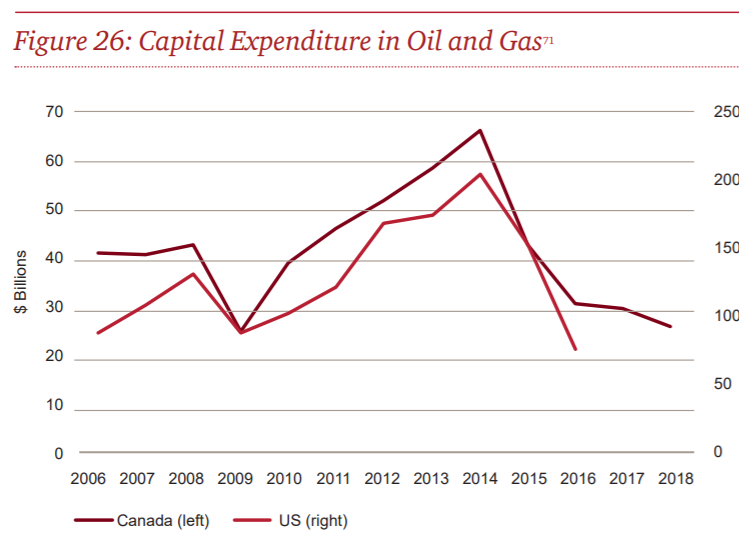
In the US, data that is more recent suggests that production and capital expenditure are increasing. The Dallas Fed energy survey of oil and gas firms in Texas found in Q2 2018 that oil and gas production had expanded for seven straight quarters and that the business activity index was positive, indicating expansion.
Key sector trends
The following factors are important determinants of investment and production in the oil and gas industry in the US, and are important to keep in mind when considering the incremental effect of US tax reforms. In both countries, global oil prices are a major determinant of production and investment. There has been downward pressure on costs, although the drivers of cost decreases have been different in the US due to different geologies. For example, shale oil has been a major growth area in the US, while it has not yet been extracted commercially in Canada. Both countries risk constraints on crude oil revenue based on pipeline capacity: the Dallas Fed Energy Survey of producers in Texas found that 55% of respondents in the second quarter of 2018 expected lack of crude oil pipeline capacity to limit near-term growth.
Global oil and gas prices
Global oil and gas prices are one of the factors that determine whether it is economical to invest in new projects. Historically, Alberta’s oil sands have had higher costs of production compared to other regions. Ten years ago, when global oil prices were over $100/barrel (“bbl”), there was more investment in large-scale mining projects, which have a higher per-barrel cost compared to other methods of oil extraction.
Today, crude oil prices are substantially lower with Western Canadian Select (“WCS”) prices below $40/bbl, and the nature of new investment in the oil sands has changed as a result. Producers still active in the oil sands are focusing on developing in-situ projects, which have a lower per barrel cost compared to mining. In addition, these producers are developing technology that will further lower costs of production.
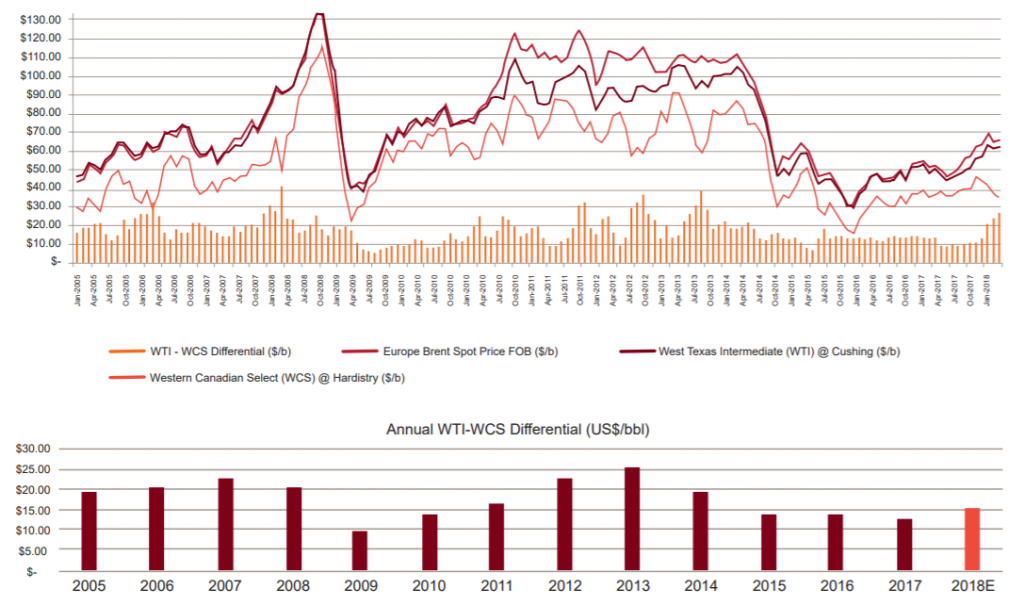
The shale revolution
The development of hydraulic fracturing, also known as fracking, represented a major shift in US oil and gas productions starting around 2005. Without this technology, it is not possible to extract oil and gas from “tight” i.e. less porous rock formations, so its introduction has dramatically increased the oil and gas reserves available. Rapid expansion of shale gas production led to a major drop in natural gas prices from typically $6/MMBtu (i.e. million BTUs) before 2009 to around $4/MMBtu or less after that.
Due to this drop in price, shale has overtaken other methods of extraction, and now accounts for 50% of natural gas production in the US. Hydraulic fracturing is used to extract natural gas in Canada, but has not yet been applied commercially to extract shale oil.
The technology used for shale gas and shale oil extraction are similar. The cost of drilling wells for shale gas and shale oil extraction decreased between 2012 and 2016 due to improvements in processes and technology such as multi-pad drilling. Since they were introduced, shale gas and shale oil have been the main drivers of oil and gas growth in the US. All future growth in both oil and gas extraction is expected to come from shale sources.
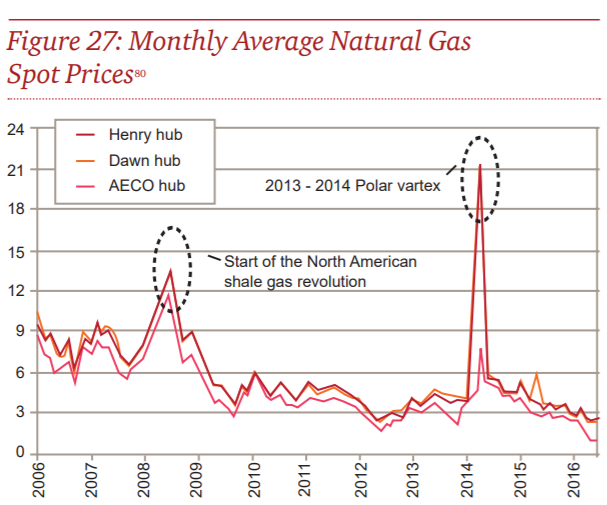
The drop in natural gas prices following the North American shale gas revolution has also had an impact on Canadian production. Around 2008, commercial use of hydraulic fracturing in the US significantly expanded natural gas production, and prices have largely not recovered since then. Figure 27 shows natural gas prices since 2006. Henry Hub and Alberta Energy Company (“AECO”) hub are the standard price indexes for the US and Canada, respectively.
The WCS-WTI spread
The WCS-WTI spread refers to the difference in price between Western Canada Select and West Texas Intermediate, standard price measures for the Canada and the US respectively. The two main drivers of the WCS-WTI spread are oil quality and transportation cost. Bitumen extracted in Canada is relatively heavy and sour (having a higher sulphur content) compared to most crude oil extracted in the US. This means that the cost of refining Canadian crude into finished products such as gasoline is higher. Transportation costs are another main driver of the WCS-WTI spread. Higher transportation costs lead to a lower relative WCS cost and lower revenues for producers. Crude oil can be transported via pipeline, rail, or ship, but pipeline currently has the lowest cost at around $6 USD/ bbl compared to around $20 for rail. Pipeline capacity constraints have substantially increased the spread: a CIBC Economics report estimates the neutral WCS-WTI spread to be $15 USD/bbl, whereas the estimated average for 2018 is around $20. The report predicts that transportation costs will continue to increase until 2021, after the Line 3 and Keystone XL pipelines are completed.
Regulation
Industry members cite regulation as a major factor contributing to declining investment in the oil sands. Regulatory concerns include uncertainty around approval processes for pipelines and projects.
As noted above, constraints on pipeline capacity have led to lower prices for producers in Alberta, making Canada less attractive to investors. Transportation costs to producers are projected to continue to increase if more pipeline capacity is not built. Therefore, cancellations of pipelines and perceived uncertainty around approvals processes have discouraged investment in Canada’s oil sands. In 2014, the federal government cancelled the Northern Gateway pipeline and in 2017, the Energy East pipeline was cancelled, with regulation being one reason cited. While the Line 3 and Trans Mountain pipelines have been approved, an attempt by the British Columbia government to block the Trans Mountain pipeline led to the federal government buying the project to ensure its completion.
The federal government has also introduced legislation that could complicate the approvals process for energy and mining developments. Bill C-69 would require an impact assessment of proposed projects’ environmental, health, social, economic, and indigenous impacts over the long term. Under the new legislation, the Minister of the Environment and in some cases cabinet must agree that any adverse effects of a proposed project are in the public interest. Critics say that the criteria lack clarity and will increase project approval timelines.
Investment decisions
In order to understand the incremental impact of US tax reform on investment decisions, we first outline the decision-making process of investors in the oil and gas industry. This section outlines the factors that are important in making investment decisions and assesses the relative importance of taxes.
Investments in oil and gas are unique because of the idiosyncratic nature of geological formations. Even within one region, the appropriate extraction method, costs of drilling, and output will vary based on geology. The timeline, risk, and potential returns also vary substantially. Developments in the oil sands tend to last decades, while a shale play in the US may produce for only 12—18 months.
From discussions with industry participants, we understand that the following factors are important determinants of investment decisions:
- Expectations of commodity prices. Short- and long-term commodity prices are crucial to determining whether a given investment will be profitable.
- Transportation. As described above, restrictions on pipeline access reduce producer revenue. Given that Canada’s pipelines already have capacity constraints, this is an important factor.
- Regulation. Criteria and timeline for project approval, environmental regulations, expectations for community consultation, and other regulatory factors can have a large effect on costs and timelines, particularly given the cyclical nature of the industry.
- Risks. Geological factors, political instability or uncertainty, and global markets all introduce risk. Investors may want to compensate for this by seeking higher returns.
- Timelines. The nature of the investment determines the timelines for realizing a return. Projects in Canada’s oil sands tend to be longer-term in nature compared to most oil extraction in the US. Private equity investors may look at a shorter term for returns.
- Taxes. Taxes can have a significant impact on the economics of a project, although they are unlikely to be the deciding factor on their own.
Cost structures in Canada and the U.S.
This analysis assesses the breakeven costs of new investment in crude oil and natural gas in Canada and the US. The breakeven cost is the price at which it would be economical to drill a new well. It is the price needed to cover capital expenditures, operating costs, royalties and taxes, and return on investment.
Crude oil
Canadian data on estimated breakeven costs for crude oil comes from the Canadian Energy Research Institute, and assumes a discount rate of 10%, and a real rate of return of 10%. These costs are based on the projects that were in development in 2017, all of which are based on steam-assisted gravity drilling (“SAGD”), a method of in-situ oil sands extraction.
US data on breakeven costs comes from the Dallas Fed Energy Survey. Because the breakeven cost is based on survey results, we do not know the underlying assumptions. Different assumptions of discount rates and rates of return would affect the breakeven price.
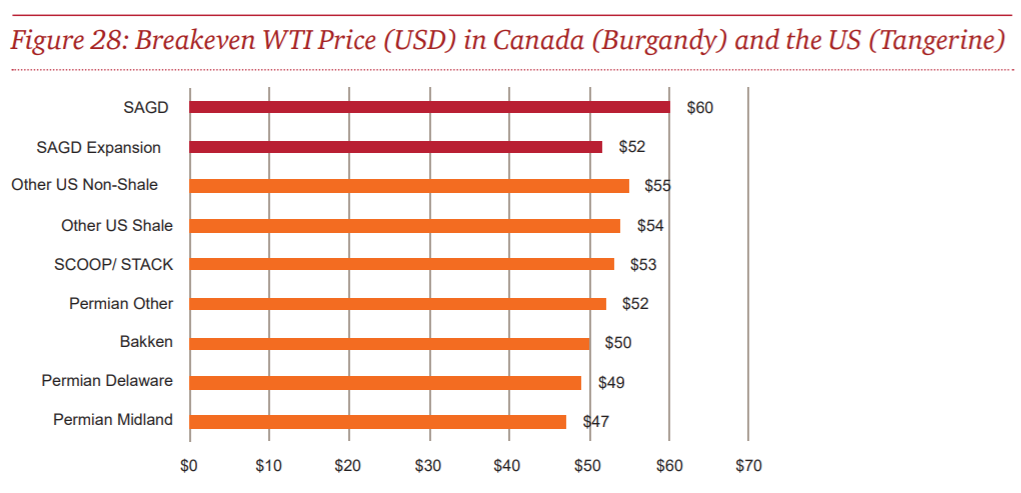
Overall, new wells in Canada have a higher breakeven price than new wells in the US. Given that oil sands are considered a riskier investment compared to US shale plays because of the longer timelines, this suggests on its face that prior to tax reform, Canada was less attractive to oil investment than the US. As noted previously, international energy companies have been divesting from the oil sands by selling assets to Canadian companies focused on the oil sands. These Canadian companies are unlikely to move investments to the US even though costs are higher in Canada. However, many energy companies are funded by private equity firms, which prioritize projects with higher returns. US-based private equity firms are now prioritizing US projects over Canadian projects due to lower pre-existing returns, and the greater post-tax return provided by the US tax reform.
We note that although Canada is currently less competitive than the US, oil sands breakeven costs have come down substantially over the past few years: in 2015, CERI estimated that the breakeven WTI price for a new SAGD well was $80, compared to $60 in 2017. Additionally, some producers have breakeven costs well below the average. MEG, Cenovus, and Suncor have reported breakeven prices of $45, $40, and $37 respectively. Major producers in the oil sands are focused on technological advances that will further decrease costs. Therefore, despite the higher breakeven costs, expectations of further cost decreases or a desire for longer-term investments may attract investors to Alberta.
Natural gas
The natural gas investment environment is very different from that for crude oil. Although global demand is expected to rise, prices are expected to remain relatively low. Currently, Canada’s only export market is the US, and exports have decreased as supply in the US has increased. However, the construction of LNG facilities on the west coast would make exports to Asia possible, as LNG can be shipped overseas.
After the shale revolution, the number of new wells completed in Western Canada has dropped significantly. Production figures have reflected the same trend: between 2005 and 2015, natural gas production in Canada decreased slightly while in the US it increased by 50%. New drilling that has occurred is in areas that are rich in natural gas liquids (“NGL”), which have a higher value.
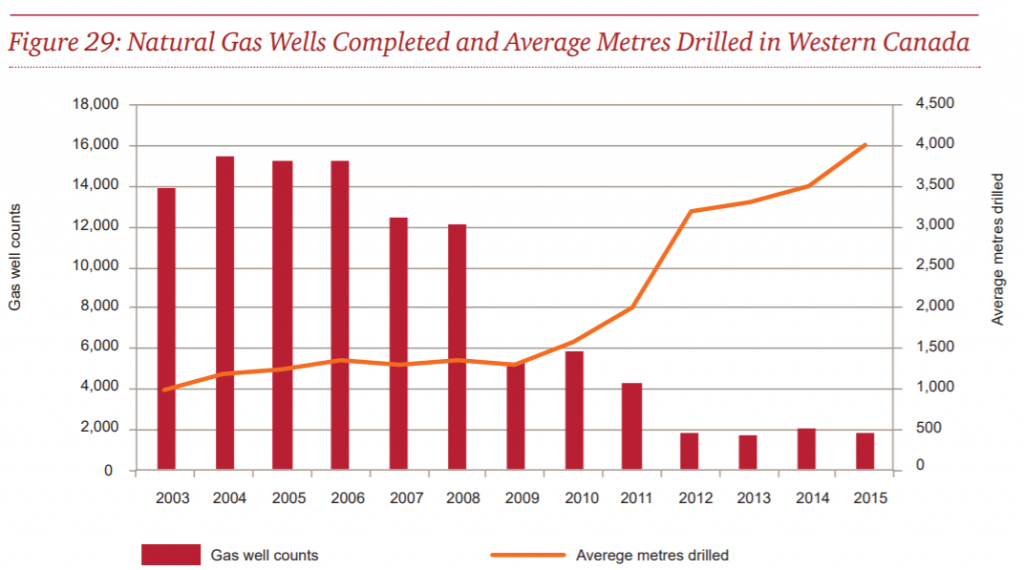
According to projections by the National Energy Board, if the Henry Hub price remains below $4/Btu, it will not be economical to drill additional wells in Canada. On the other hand, many wells in the US have breakeven prices below $4, or even negative breakeven prices, as natural gas known as “associated gas” is produced when crude oil is extracted. Figure 30 shows the breakeven price, not including transportation cost, at several basins in the US.
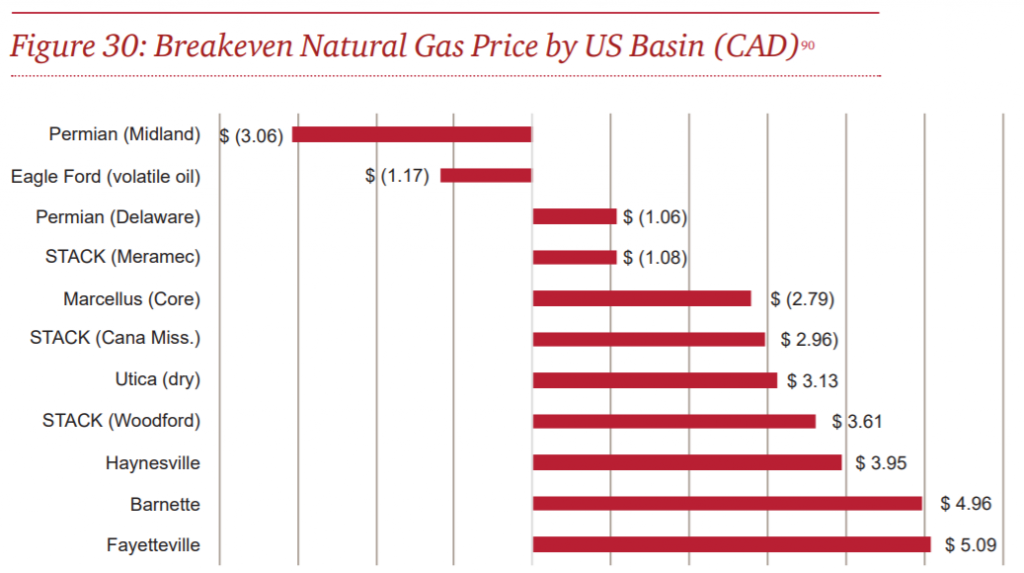
The majority of breakeven costs are below those of Canadian producers, suggesting that unless there is a major increase in natural gas prices, the US will remain a more attractive destination for investment in natural gas. These trends suggest that the US tax reform is likely to exacerbate the decrease in investment in Canada. Discussions with industry participants have indicated that natural gas companies are investing in the US when looking to grow, and making only sustaining capital investments in Canada. Reasons for this are low natural gas prices, low cost of production in the US, regulatory issues, and a lack of export markets from Canada.
Tax impacts
The following figure and tables present the effective average tax rates and effective marginal tax rates in oil and gas extraction jurisdictions.
The figure below presents the effective average tax rates in oil and gas extraction jurisdictions. The jurisdictions included here are Alberta, Texas (TX), and Louisiana (LA). For more details on tax rate calculations, see Appendix B: Tax analysis methodology.
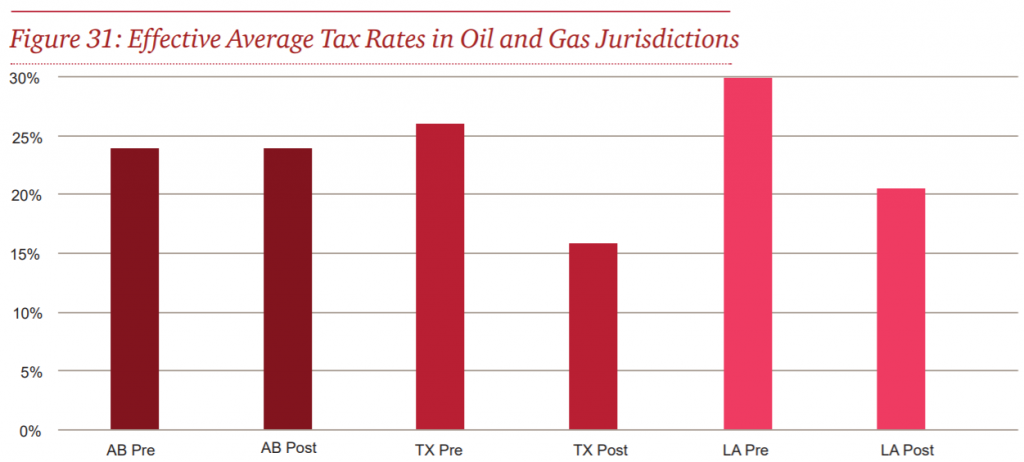
The following tables present the effective average tax rates and effective marginal tax rates in the main oil and gas extraction jurisdictions. We note that these rates do not include royalties. FDII rates are not shown because FDII does not apply to oil and gas.
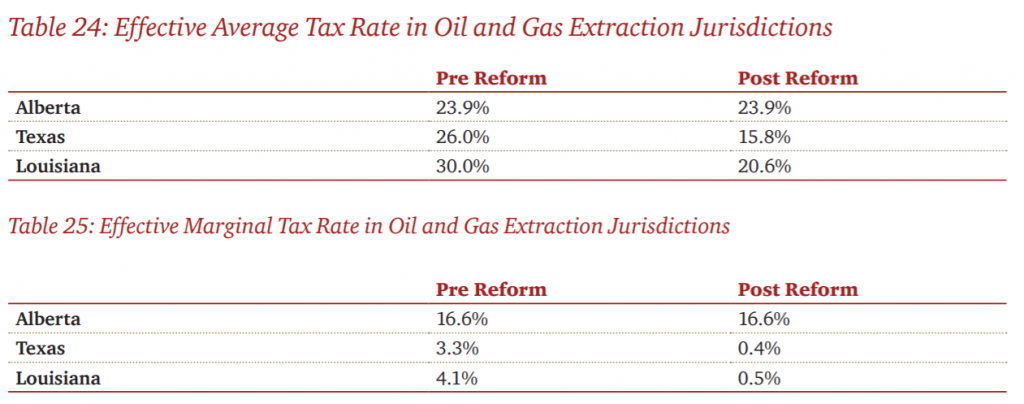
Rate of return
While each project is different, our analysis suggests that the pre-tax rate of return in the US is slightly higher than that in Canada. Given the increasingly important role played by governments in the energy sector as it relates to approvals and regulations, tax is a secondary consideration in oil and gas investment decisions, but could affect marginal decisions.
Likely expectations
Taking all of the above into consideration, it is our view that US tax reform, all else being equal, will have a negligible impact on oil and gas extraction in the short term, and a small negative impact in the long term.
Oil sands projects are long-term investments with substantial sunk costs, so we do not expect any existing projects to be impacted. However, US tax reform is likely to exacerbate the trend of exploration investment shifting away from Canada and towards the US. This is particularly true for junior companies funded by private equity.
Currently, the low natural gas prices in Canada and challenging regulatory environment have made Canada less attractive to new natural gas development. Until there is certainty about the construction of a LNG facility in British Columbia, investment is likely to continue to decrease. Although taxes are not the most important factor in this industry, tax reform may further discourage investment in Canada.
The table below shows the portion of the sector that is “at risk” based on our assessment. It includes the direct economic impact of the oil and gas extraction industry in Canada, and the associated indirect, or upstream economic impact. Based on our analysis, a small portion of this industry will be at risk in the long term. This assessment is based on the US tax reform worsening the existing trend of decreasing investment in both oil and gas. We represent this view numerically by suggesting that 10% of the total oil and gas economic footprint is at risk.

We note that a construction of LNG facilities in British Columbia would likely reverse most of the expected loss in natural gas investment. If this occurs, the negative impact envisioned above is overstated.

Plastic and rubber manufacturing
This sector processes raw rubber and plastics materials to manufacture finished products. Downstream consumers include other manufacturers of consumer products, construction, and direct consumer markets. The following industries are included in the sector:
- Plastic products manufacturing. This subsector accounts for more than 80% of the sector’s GDP. It includes the following industries:
- Plastic film, sheet and bag manufacturing
- Plastic pipe and parts manufacturing
- Plastic bottle manufacturing
- Other plastic products manufacturing
- Rubber products manufacturing. This subsector accounts for about 20% of the sector’s GDP and includes the following industries:
- Tire manufacturing
- Rubber product manufacturing
- Hose and Belt manufacturing

Plastic and rubber manufacturing in Canada
Prior to the 2008 recession, plastic and rubber manufacturing had been declining in Canada. Since then it has recovered, but growth has been relatively slow. In Canada, the manufacturing facilities for this sector are located in Ontario and Quebec and tend to be near the US border because the US is Canada’s largest trading partner in this sector.
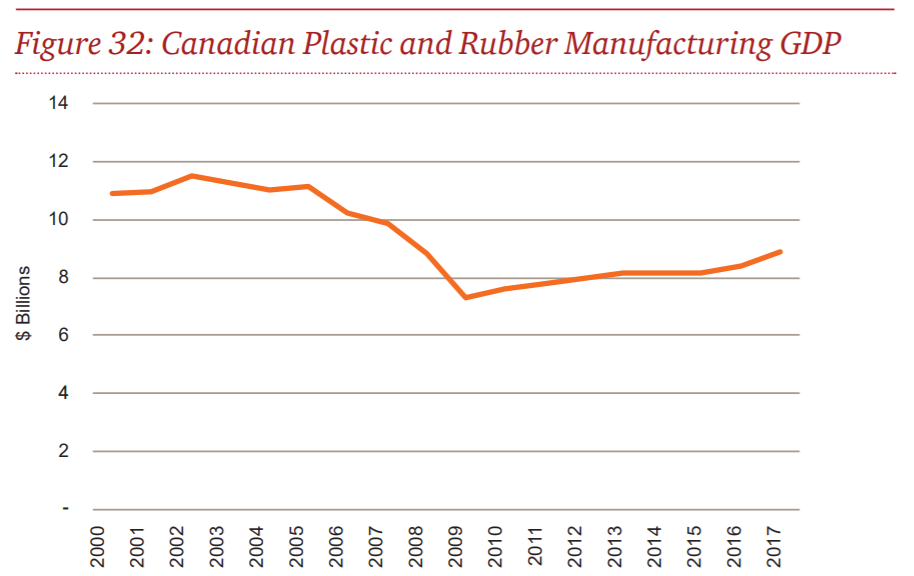
Plastic and rubber manufacturing in the U.S.
The trends in GDP in the US are similar to those in Canada, suggesting that the two sectors are highly integrated. In the US, plastic and rubber manufacturing facilities are concentrated in the manufacturing states of California, Texas and Ohio.
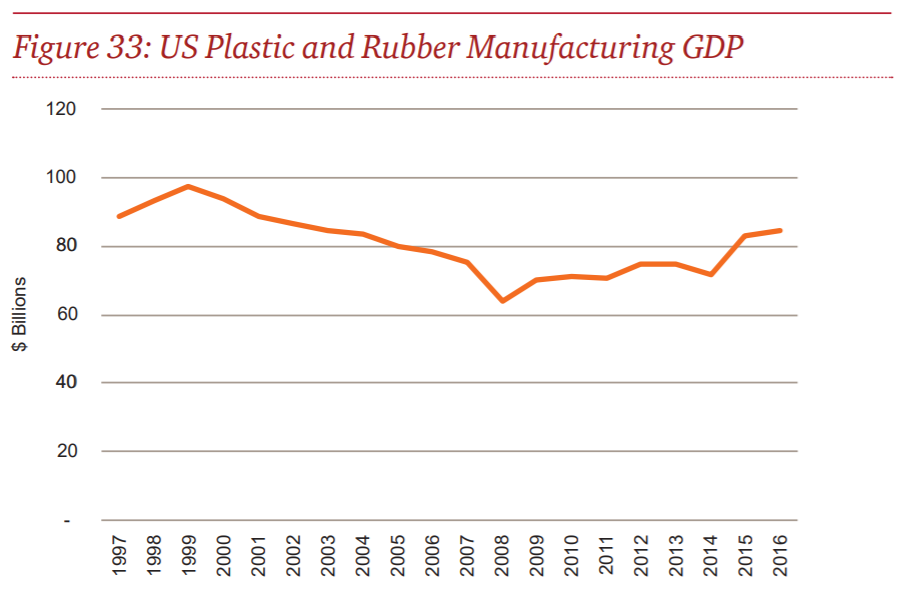
Investment trends
Capital expenditure in plastic and rubber manufacturing was increasing in both Canada and the US over the first half of this decade, but has been somewhat volatile in Canada.
Investment in the US since 2016 has also been weak, as manufacturers moved facilities overseas. The manufacturers that have stayed onshore have continued to invest to maintain capacity and efficiency.
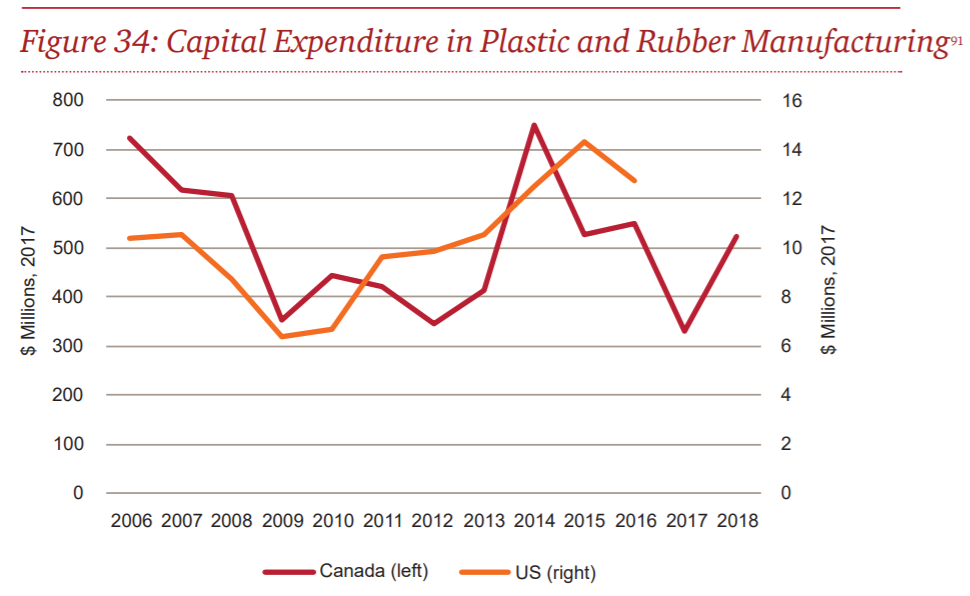
Key sector trends
The following key industry trends are important for competitiveness in Canada and the US for plastic and rubber manufacturing:
- Market maturity. This industry is mature, so new investment is largely focused on reducing costs.
- Consolidation. Since 2013, many less profitable operators have relocated abroad or are being acquired by larger operators to lower costs through vertical integration and economies of scale.
- Rising imports to Canada. Imports meet an increasing share of domestic demand, aided by greater economies of scale.
- Smaller Canadian operations. For plastic bottle manufacturing, the large players locate in the US to conduct R&D for new product types and production processes and have smaller facilities in Canada.
- Industry 4.0. Greater automation has brought investment back to North America from jurisdictions with lower labour costs and will entail substantial capital investment in coming years.
Investment decisions
From discussions with subject matter specialists, we understand that the following factors are important determinants of investment decisions for this industry:
- Input prices. The largest component of cost raw material purchases, most notably polyethylene. This input is available at a lower cost in the US.
- Proximity to downstream markets. The US is Canada’s the largest trading partner, so facilities locate near the border to lower transportation costs and enable easier communication with customers. US companies have a natural advantage in location to serve the larger US market.
- Taxes. Taxes could be a deciding factor given that the US is the main market for plastic and rubber goods, and cost structures in Canada and the US are otherwise similar.
Tax impacts
The following figures and tables present the effective average tax rates and effective marginal tax rates in plastic manufacturing jurisdictions and rubber manufacturing jurisdictions.
The jurisdictions included here are Ontario, Quebec, California (CA), Ohio (OH), Texas (TX), and North Carolina (NC). For more details on tax rate calculations, see Appendix B: Tax analysis methodology. The following figure and tables present the effective average tax rates and effective marginal tax rates in the main plastic manufacturing jurisdictions.
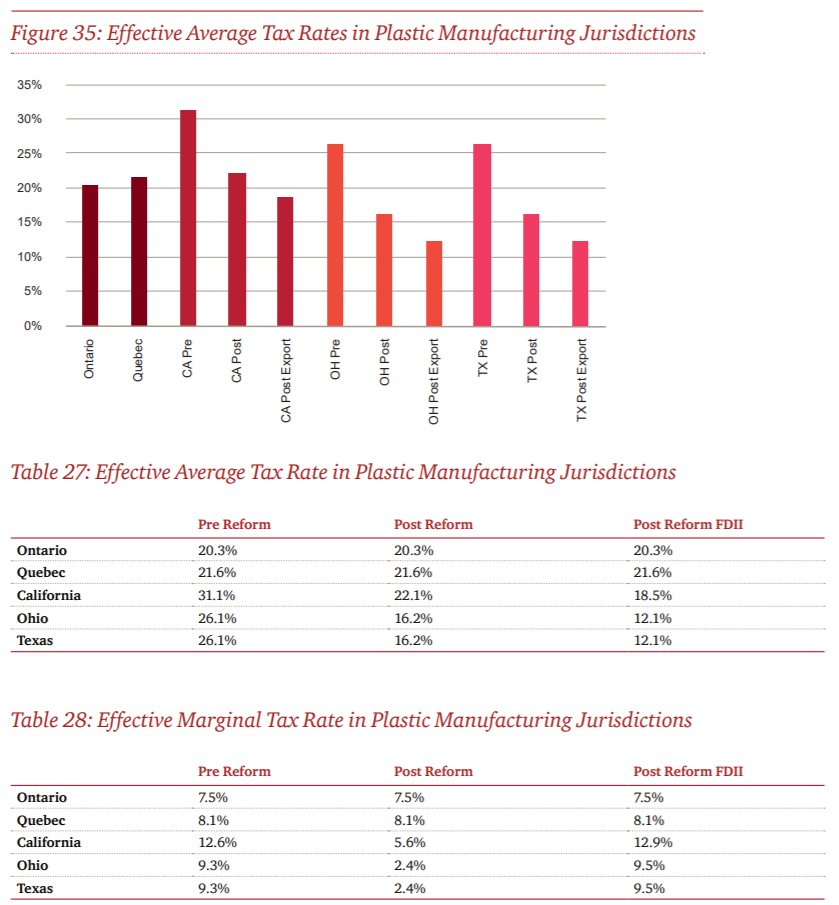
The following figure and tables present the effective average tax rates and effective marginal tax rates in the main rubber manufacturing jurisdictions.
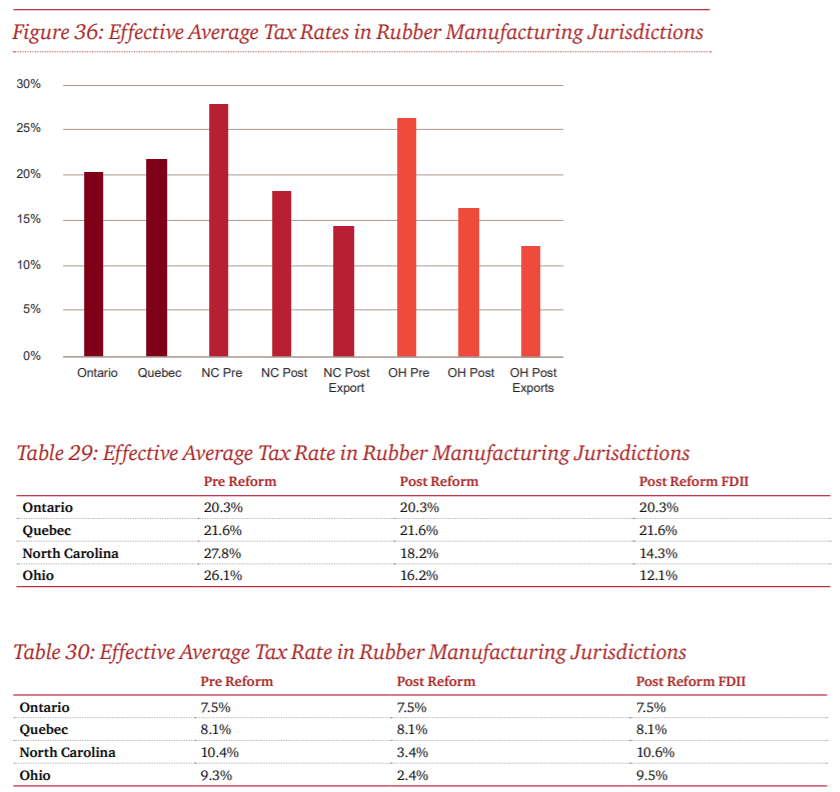
Rate of return
Our analysis suggests that, on average, plastic and rubber manufacturing industries in Canada and the US have similar rates of pre-tax return. Pre-US tax reform, Canada enjoyed a higher average after-tax rate of return. Post-US tax reform, the US now has the advantage in average after-tax rate of return.
Likely expectations
Taking all of the above into consideration, it is our view that the US tax reform, all else being equal, will have a small negative impact on plastic and rubber manufacturing in the short term and a large negative impact in the long term. The reasons for this are the following:
- This industry competes primarily on prices and profit margins.
- Prior to US tax reform, Canadian manufacturers were already facing challenges to maintain competitive profit margins.
- Industry 4.0 is expected to create the need for substantial new investment in this sector in order to control costs.
- The increase in post-tax return in the US will have a significant impact on investment decisions.
The table below shows the portion of this sector that is “at risk” based on our assessment. This includes the direct economic impact of the plastic and rubber sector in Canada and the associated indirect, or upstream economic impact. Based on our analysis, a large part of this sector is at risk in the long-term. We represent this view numerically by suggesting that 75% of the economic footprint of this sector is at risk.


Primary Metal Manufacturing
Primary metal manufacturing includes the smelting and refining of metals such as steel and aluminium from ore, and manufacturing alloys. The three main groups of primary metals manufactured in Canada are iron and steel, aluminium, and other nonferrous metals such as copper, zinc and lead. In this report, we focus on three industries within the primary metal manufacturing sector:
- Aluminium manufacturing
- Nonferrous metal refining (copper, zinc, lead and nickel)
- Metal pipe and tube manufacturing
Together, these three industries account for 64% of primary metal manufacturing revenue in Canada. Industries related to iron and steel manufacturing have been excluded because in these industries, Canadian industry revenue has been declining and major producers have idled facilities. Therefore, new investment is not likely to occur in these industries in Canada regardless of changes from US tax reform. If demand increases and companies want to increase production, they have the option of bringing idled facilities back into use.

Primary metal manufacturing in Canada
Canada is the world’s third-largest producer of primary aluminium after China and Russia, accounting for 5.6% of global output.92 Canada has ten aluminium smelters and one refinery, all of which are in Quebec except for the Kitimat smelter in British Columbia. Quebec is a top jurisdiction for aluminium smelting because of its low-cost and abundant hydroelectric energy. Aluminium manufacturing is one of the most energy-intensive manufacturing industries in North America.
Nonferrous metal refining takes place mainly in Quebec and Ontario, with a smaller footprint in British Columbia and Alberta. In Canada, this mainly consists of copper, zinc, and lead refining, and refineries are often located close to mines. Metal pipe and tube manufacturing is located primarily in Ontario and Alberta. Ontario has the advantage of being close to steel manufacturing, while Alberta is close to downstream consumers in the oil and gas industry.
Figure 37 shows total primary metal manufacturing GDP in Canada and by province. This includes industries not included in our analysis. Overall, GDP in the industry has been trending upwards since 2009, but remains below its 2005 peak.
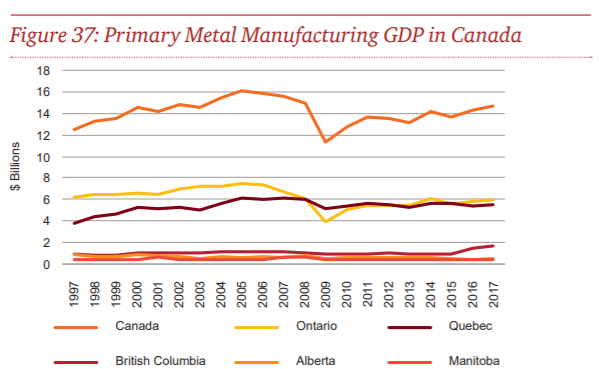
Primary metal manufacturing in the U.S.
The US is the ninth largest producer of primary aluminium, accounting for 1.6% of global production in 2016.93 In the US, aluminium smelters are located in Washington, New York, Indiana, Kentucky and South Carolina. Nonferrous metal manufacturing is concentrated in New York, Pennsylvania, Indiana, and Ohio. Copper and gold refining are the main activities within this industry. Canada refines a substantial amount of copper, but in contrast to the US also focuses on nickel and zinc. Metal pipe and tube manufacturing is located in the Great Lakes region and Texas.
Figure 38 shows GDP from US primary metal manufacturing. The industry was seriously impacted by the 2008 recession and although it recovered somewhat, GDP has been trending downward since 2012.
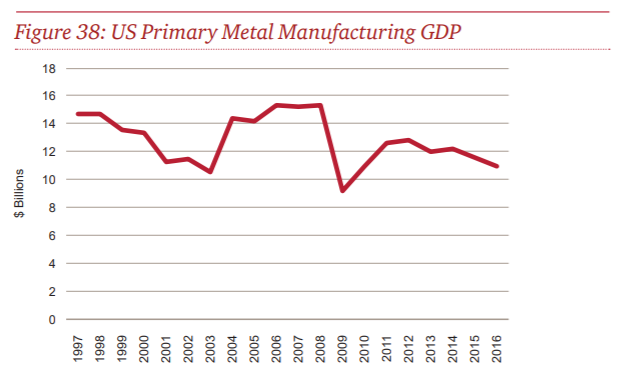
Investment trends
Figure 39 shows capital expenditures in primary metal manufacturing. In Canada, capital expenditure has been increasing since 2016, but remains well below its 2012 peak. In the US, it has been trending downward since its peak in 2013.
US capital expenditure in aluminium manufacturing, continues to decrease, as the US remains uncompetitive. According to analyst reports, US investment in nonferrous metal smelting has been relatively flat over the past few years.
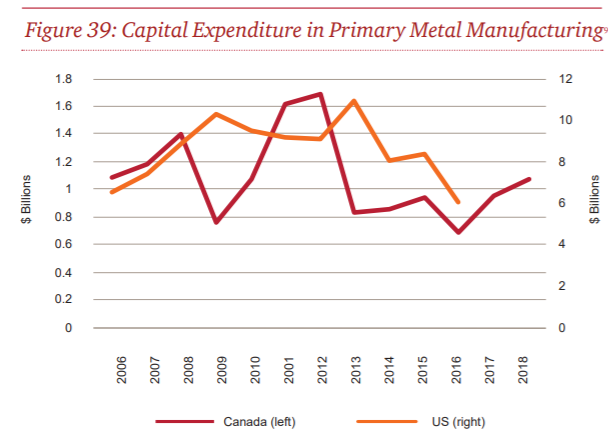
Key sector trends
The following section reviews key trends in the industry that are important to understanding the context of the impact of tax reform.
Global markets
Prices and demand for primary metal products are determined globally. The following reviews important global trends in these industries.
China produces more than half of the world’s aluminium, with most of this capacity added since 2000. Costs are competitive and are now below the US. However, industry associations have accused the Chinese government of providing subsidies and other market distortions that have led to global overproduction and lowered prices. Recently China’s capacity has decreased, lessening the problem of global over-production. Higher aluminium prices would likely spur greater investment in North America.
Copper prices have also recently suffered from global overproduction, influencing demand for copper refining. Metal pipe and tube manufacturing has been hurt by low steel prices as well as low demand from the oil and gas industry.
Electricity cost
Aluminium is by far the most energy-intensive major product produced in the US. Therefore, a key determinant of where production occurs is energy cost. US aluminium production has been decreasing since the 1980s, but production halved following at price drop in 2015. Many US smelters have been curtailed or idled. Over the same period, Canadian production was increasing slightly, as shown in Figure 40.
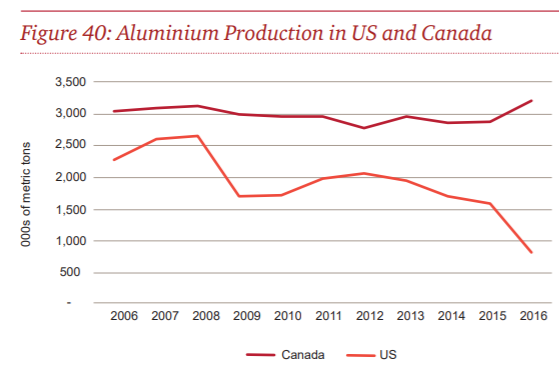
Canada’s main cost advantage comes from the low-cost hydroelectric energy available in Quebec. Canada is the world’s second-largest producer of hydroelectric energy after China, and is currently a net exporter of hydroelectric energy to the US. Over half of Canada’s hydroelectric energy exports go to New England and New York, where they meet 12—16% of
energy needs. Hydro Quebec plans to increase energy exports to the US substantially, which will require constructing new connecting lines. Currently there are three proposed connecting lines going to Massachusetts, and one to New York. These plans face political and regulatory hurdles: community groups in New Hampshire have shut down plans for one of the Massachusetts lines, and another that would go through Maine is currently under consideration by regulators.
Therefore, although Quebec has the ability to increase capacity and exports, the future of energy exports from Quebec remains unclear. Canada’s cost advantage would likely disappear if US producers were able to access electricity at Canada’s low rates.
Although nonferrous metal refining and metal pipe and tube manufacturing are also energy intensive, energy cost does not play as large a role in determining investment location compared with aluminium manufacturing.
Downstream industries
Demand from downstream industries is an important determinant of growth in primary metal manufacturing. Trade is important in primary metal manufacturing, so downstream in the US and Canada are both important. Consumers of aluminium include packaging and transportation manufacturers, who favour aluminium because it is lightweight and strong which is ideal for higher-efficiency vehicles.
The metal pipe and tube industry is highly dependent on demand from oil and gas producers, so the success of the industry follows the commodity cycle. Other consumers of metal pipe and tube products include waterworks and residential and non-residential construction. Construction, industrial uses and jewellery are the main downstream markets for nonferrous metal refining. Copper is a key input for construction and infrastructure projects.
Technological change
Technological change in primary metal manufacturing has meant that companies must continuously make new investments in order to remain competitive. In aluminium manufacturing, Rio Tinto has made substantial investment in Canada in order to increase efficiency and lower emissions. In contrast, most US aluminium smelters are relatively old and inefficient. One Missouri aluminium smelter that had been idled due to bankruptcy has restarted after 10% tariffs were introduced, but this trend is not likely to continue.
Operators of nonferrous metal refineries also make continuous investments to increase efficiency and lower emissions. In metal pipe and tube manufacturing, producers are using technology including automation to lower costs, and producers that do not do so will no longer be competitive.
Investment decisions
From discussions with subject matter specialists, we understand that the following factors are important determinants of investment decisions:
Expectations of commodity prices. Commodity prices are determined globally and are crucial to determining whether a given investment will be profitable.
Access to downstream markets. This industry is export-intensive, and performance of downstream industries is a major determinant of profitability.
Energy prices. In aluminium manufacturing, this is the most important determinant of investment location. If the US can import Canadian energy, Canada’s advantage will disappear.
Proximity to inputs. Refinery capacity tends to be located close to mineral extraction, and some producers are vertically integrated.
Tax impacts
The following figure and tables present the effective average tax rates and effective marginal tax rates in primary metal manufacturing jurisdictions.
The jurisdictions included here are Ontario, Quebec, British Columbia, New York (NY), Ohio (OH), and Pennsylvania (PA). For more details on tax rate calculations, see Appendix B: Tax analysis methodology.
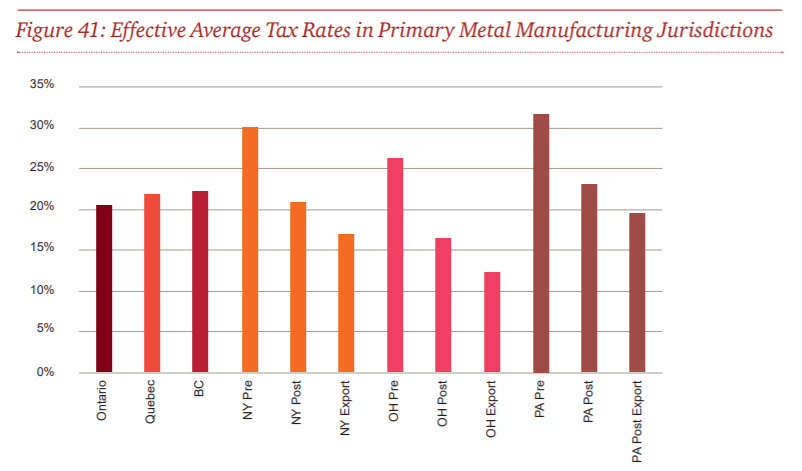
The following tables present the effective average tax rates and effective marginal tax rates in the main primary metal manufacturing jurisdictions.
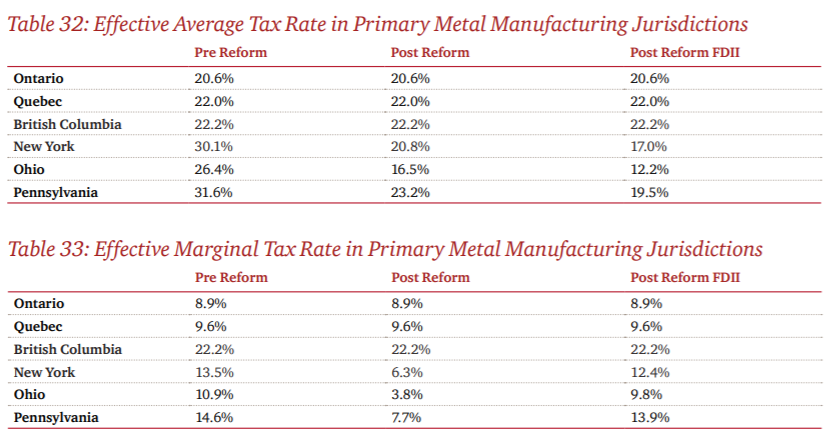
Rate of return
In aluminium manufacturing, pre-tax rates of return are substantially higher in Canada. However, as noted above, much of this advantage stems from lower electricity rates available in Canada. For other primary metal manufacturing industries, energy availability is not a deciding factor. Currently, the US and Canada are competitive under the status quo, the US tax reform could affect future investment decisions, especially given the capital-intensive nature of the industry.
Likely expectations
Taking all of the above into consideration, we are of the view that the US tax reform, all else being equal, will have a negligible impact on primary metal manufacturing in the short term and a small negative impact in the long term.
In aluminium manufacturing, Canada has a large cost advantage due to the availability of hydroelectric energy. If Hydro Quebec is successful in increasing exports to the US, this cost advantage may disappear. Given the capital-intensive nature of the industry, US tax reform would likely cause some investment to flow toward the US rather than Canada.
The table below shows the portion of this sector “at risk” based on our assessment. This includes the direct economic impact of the primary metal manufacturing sector in Canada, and the associated indirect, or upstream economic impact. These figures are based on nonferrous metal refining and processing only. We consider the likely impact on aluminium to be negligible. We reflect our view of a small to moderate impact in the long run numerically by suggesting that 25% of the total economic footprint of the nonferrous metal refining and processing industry is at risk in the long term.


Transportation Equipment Manufacturing
This sector manufactures equipment for transporting people and goods. This sector is comprised of seven industries:
- Motor vehicle parts manufacturing
- Motor vehicle manufacturing
- Motor vehicle body and trailer manufacturing
- Aerospace products and parts manufacturing
- Ship and boat building
- Railroad rolling stock manufacturing
- Other transportation equipment manufacturing
For the purposes of our analysis, we focus on motor vehicle parts manufacturing, motor vehicle manufacturing, and motor vehicle body and trailer manufacturing. We have excluded aerospace because both defence and commercial markets are largely driven by government policies and regulations that aim to keep manufacturing and R&D in Canada. Similarly, we have excluded ship and boat building because investment decisions are largely driven by government policies that support production in Canada. Additionally, different companies are present in US and Canada, suggesting that capital is less mobile between countries.
We have not analyzed railroad rolling stock and other manufacturing detail due to their small share of overall transportation manufacturing. To the extent railroad rolling stock is driven by government policies, it will not be impacted. The other manufacturing components will have similar impact as previously discussed for the automotive manufacturing industry discussed below, but we have not quantified these impacts.

Transportation manufacturing in Canada
In 2017, transportation manufacturing contributed 35.7 billion CAD to Canada’s GDP, remaining well below its prerecession peak. This industry is concentrated in Ontario, which accounts for 70% of the sector’s GDP.
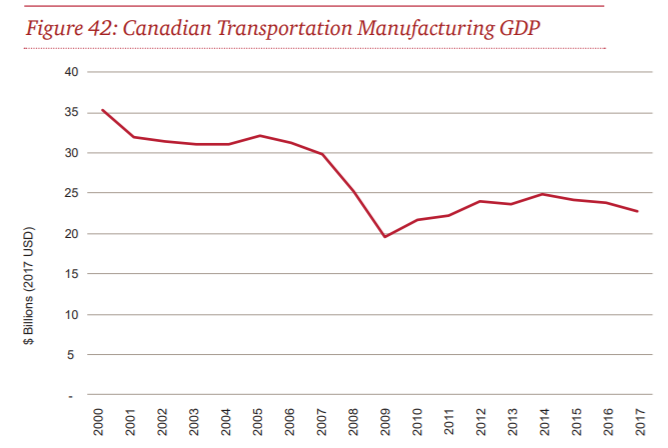
Transportation manufacturing in the U.S.
In 2016, US transportation manufacturing GDP was $302 billion USD. Unlike in Canada, the industry’s GDP has now exceeded its pre-recession peak.
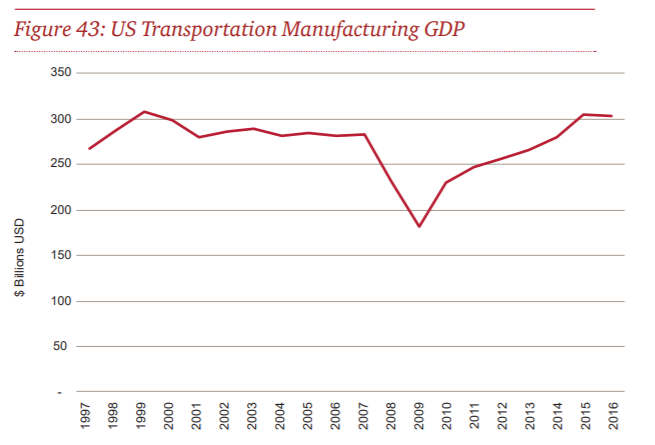
US automotive manufacturing is centred around two hubs:
- Great Lakes region. Around 30% of manufacturers are located in this region. The largest concentration is in Michigan in the US. Manufacturers typically build close to markets and suppliers due to high transportation costs. Being in close proximity to Ontario, the US counterpart in this region is the key competitor for investment.
- Southern US. New investment is flowing to this region due to relatively low labour costs compared to the Great Lakes Region. Despite higher profit margins, transportation costs make it costly to export to Canada from this region. Our tax analysis focuses on South Carolina and Alabama as these are the hotspots for new investment in this region.
Investment trends
In 2017, Canadian capital expenditure in transportation manufacturing was $2.1 billion, of which the majority was in Ontario. Although capital expenditure rebounded after the recession, it has been decreasing since 2015. Machinery and equipment accounts for over 90% of capital expenditure, with construction accounting for the rest.
US capital expenditures in transportation manufacturing has been increasing steadily since 2011 in contrast to Canada, where capex has been decreasing since 2015. According to industry reports, large companies are continuing to make new investment in US auto assembly and auto parts manufacturing.
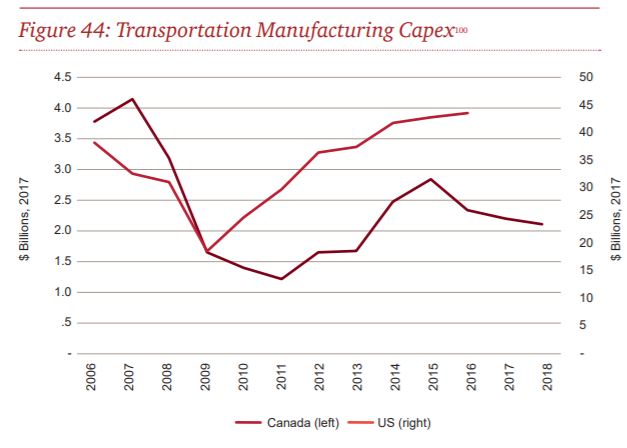
Key sector trends
The following key industry trends are important to identifying the potential impact of US tax reform:
North American integration. Since NAFTA was implemented, the North American auto manufacturing supply chain has become highly integrated. Parts often cross borders several times during the manufacturing process.
Shift towards Mexico. Recently, new investment has shifted towards Mexico, whose share of North American auto manufacturing increased from 19% in 2012 to 23% in 2017. Over this time period, Mexico’s annual growth rate in motor vehicle production was 6.4% compared to 1.7% in the US and -2.2% in Canada.
High value-add manufacturing. Despite this decline, Canadian employment in auto manufacturing has increased due to a shift towards higher value-added vehicles such as light trucks and SUVs. In 2016, about two-thirds of all vehicles produced in Canada were high value-added vehicles.
Low growth in Canada. No new assembly plants have been built in Canada in many years. Capital expenditures investment has focused on upgrading existing plants and R&D.
Investment decisions
The investment decisions relating to motor vehicle parts and motor vehicle assembly are related: Due to high transportation costs and just-in-time inventory strategy, parts manufacturing plants and assembly plants tend to be located in close proximity. Thus, the growth in production of parts and complete car correlates strongly.
Automotive assembly
We first look at automotive assembly. As noted above, Canada has not attracted new investment in automotive assembly in many years. Compared to other auto manufacturing jurisdictions, Ontario has relatively high utilities costs and very low profit margins in auto assembly. Businesses cite operating and processing costs, like labour costs, electricity costs, cap and trade regulations, administrative burdens and currency exchange risk, as the key challenge for operations in Canada.
From interviews with industry participants, we find sunk costs and loss carry-forwards (for the US companies) in existing facilities as the key reasons for not relocating existing facilities to the US. Prior to US tax reform, Canada had the advantage of low corporate tax rates and accelerated depreciation for machinery and equipment, but the US tax reform has eliminated these advantages. In the long run, domestic production may be completely replaced by exports.
Automotive parts
Canada is relatively competitive with respect to auto parts manufacturing even after the US tax reform, and about 70% of Canada’s automotive manufacturing workforce is focused on parts rather than assembly. However, this industry is also at risk because it must be located close to assembly plants and if Canada will lose assembly plants in the future, there is a risk that automotive parts will follow suit. Key players have reported that they are revisiting their investment plans for Canada due to the US tax reform. As most of the assembly plants are located in the US, auto parts manufacturers bid extensively in US. The US tax reform reduces the ability of Canadian auto parts manufacturers to compete with their US counterparts in supplying assembly plants in the US.
Tax impacts
The following figure and tables present the effective average tax rates and effective marginal tax rates in auto assembly and auto parts, separately.
The jurisdictions included here are Ontario, Michigan (MI), South Carolina (SC), and Alabama. For more details on tax rate calculations, see Appendix B: Tax analysis methodology.
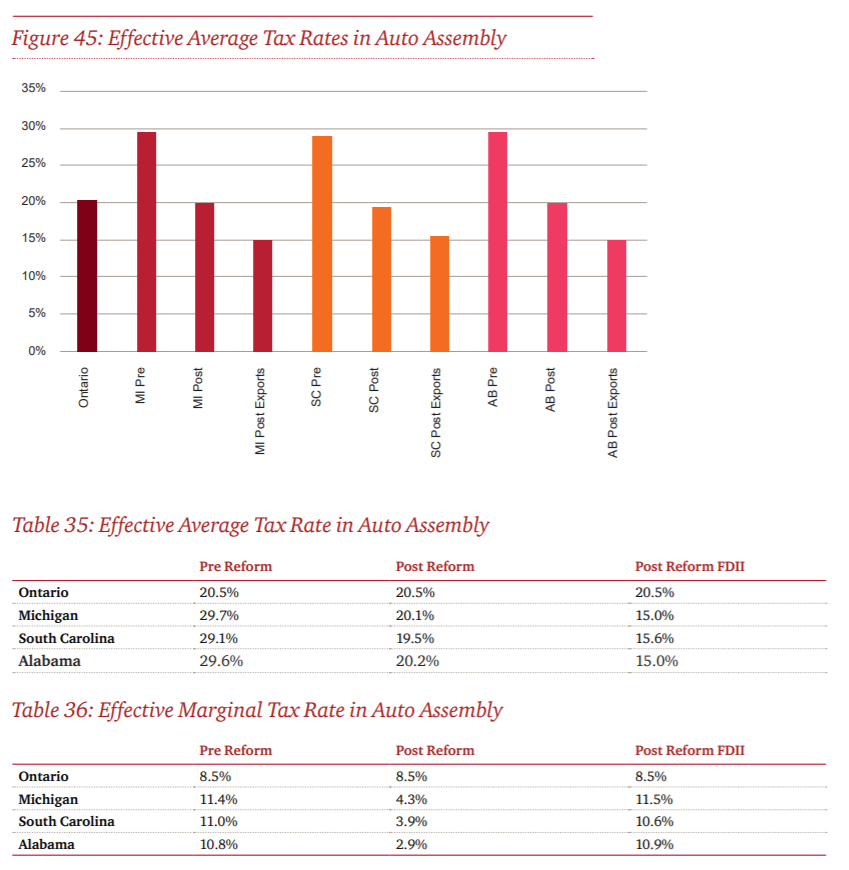
The auto assembly sector is unique because of the high ratio of debt to equity, which explains why the addition of FDII increases effective average rates.
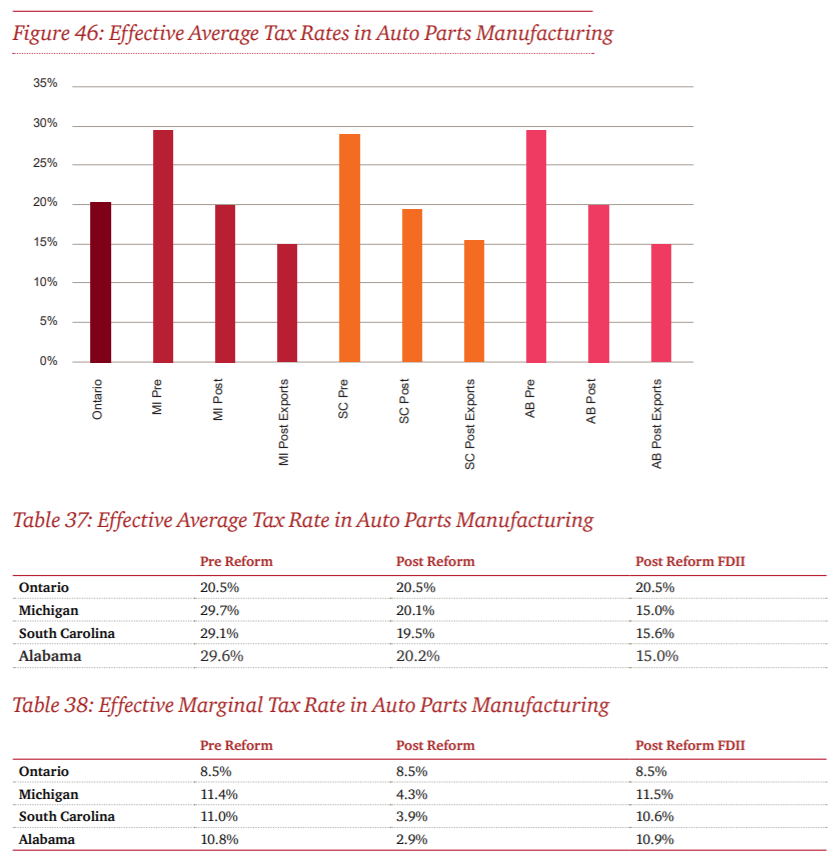
Rate of return
Pre-US tax reform, pre-tax and after-tax rates of return on auto assembly in the US were higher than in Canada. Posttax reform, the US advantage in fter-tax rate of return increased. Pre-tax and after-tax rates of return in auto parts manufacturing were higher in Canada before the US tax reform, which has now been significantly eroded.
Likely expectations
Our preliminary finding is that US tax reform will have a negligible impact on transportation manufacturing in the short term and a large negative impact in the long term.
Prior to US tax reform, automotive assembly was uncompetitive in Canada and Canada has not been attracting new investment in this industry. The US tax reform has made Canada even less attractive in this regard, so auto assembly is likely to shift to the US and Mexico in the long term.
Although auto parts manufacturing is more competitive in Canada, the loss of auto assembly would make it untenable to continue investing in auto parts manufacturing in Canada. As discussed previously, auto parts manufacturing is generally equired to be close to assembly plants to minimize transportation costs and allow “just in time” inventory. Therefore, both of these industries are at risk due to the tax reform.
The table below shows the portion of the sector that is “at risk” based on our assessment. This includes the direct economic impact of the transportation manufacturing sector and associated indirect, or upstream, impacts. Based on our analysis, a moderate to large portion of this sector is at risk in the long term. We reflect this view numerically by assessing that 75% of auto assembly and 50% of auto parts are at risk.


Research and Development

R&D activity creates high paying jobs and is essential to driving productivity growth. Like most countries, Canada and the US both offer tax credits designed to encourage R&D activity.
Although the US tax reform does not increase US R&D credits, various other provisions mean that the credits will have a larger impact. US corporations pay tax on the credits they receive, so the reduction in the US corporate tax rate increases the net value of the benefit. Additionally, the tax reform has repealed the alternative minimum tax that applied to most corporations, so instead of the minimum rate, more corporations will now pay a regular tax rate that they can partially offset with the R&D credit.
We note that although the US tax reform has increased the effectiveness of the US R&D credits, they remain well below Canadian levels. However, the GILTI rules, introduced as part of the US tax reform, will reduce the value of Canadian SRED credits to US corporations conducting R&D in Canada. The GILTI rules now mean that US-based corporations do not receive the full benefits of foreign tax credits, such as the Canadian SRED credits. In addition, income generated with intellectual property developed and commercialized in the US will be subject to a slightly lower tax rate in the US and a significantly lower rate under the FDII rules when that income is generated from export activities. A US-based company that develops intellectual property in Canada and subsequently commercializes that intellectual property in the US will incur additional tax cost.
Overall, the US tax reform has decreased the net effectiveness of Canada’s SRED credits for US-based companies and increased the net effectiveness of US R&D credits. This, together with the impact of the GILTI and FDII rules, is likely to lead to a reduction in R&D activity by US-based companies in Canada, including the spill over benefits that such activity creates.
Therefore, any R&D spending by US-based companies in Canada could be at risk due to US tax reform. Total R&D spending by businesses in Canada was $16.7 billion CAD in 2017.104 Among the top 100 corporate R&D spenders in Canada, US-based companies spent $1.8 billion.105 This suggests that US- based companies were responsible for at least 11% of private R&D spending in Canada.

Impact on Brain Drain
The term “brain drain” was coined in the 1950s to describe the outflow of scientists and technologists from Great Britain to the US and Canada. The term describes large-scale emigration of talented individuals who are educated in one country, but who choose to work in other countries because of higher salaries, prestige or greater occupational mobility.
The brain drain has a number of important economic consequences for the private and public sectors.107 First, investment in education in one country may not lead to faster economic growth if a large number of highly educated workers leave the country for employment elsewhere. Second, domestic firms may be deprived of the best talent available to them, not having the opportunity to attract newly educated and highly skilled individuals who may have helped grow their operations. As a result, politicians and policy makers around the world worry about the potential loss of valuable workers to foreign countries.

Brain drain in Canada
Concern about the brain drain in Canada peaked in the 1990s, especially after the implementation of the free trade agreement (“FTA”) in 1989, and NAFTA (i.e. the North American free trade agreement) in 1994. A well-known paper published by Statistics Canada (Zhao et al, 2000) provided evidence that during the 1990s Canada suffered a net loss of skilled workers to the US in several occupations such as physicians, professors, computer scientists and engineers. From 1991 to 1996, there were about 126,000 permanent and 52,000 temporary emigrants from Canada to the US. These emigrants had a substantial higher proportion of better-educated and higher-income earners compared to the Canadian population. For example, the emigrants to the US were five times as likely to report incomes of between $100,000– $150,000 CAD compared to the Canadian population (4.0% for emigrants and 0.9% for the general population).
While losses of highly skilled workers to the US have accelerated, Canada has attracted immigration from other countries at a much faster rate than it loses workers to the US. Multiple studies argued that the impact of the brain drain is not likely to be a concern in the Canadian context (Helliwell, 1999; Cervantes and Guellec, 2002). The annual inflow of immigrants in the late 1990s was about 0.75% of the Canadian population while the flow of emigrants to the US was 0.27% (Zhao et al, 2000). Figure 47 provides a more recent profile of immigrants to Canada. From 2007 to 2016, about 261,000 immigrants landed in Canada annually. Around the same time, 20,000 people moved to the US and landed as permanent residents of the US every year (Figure 48).
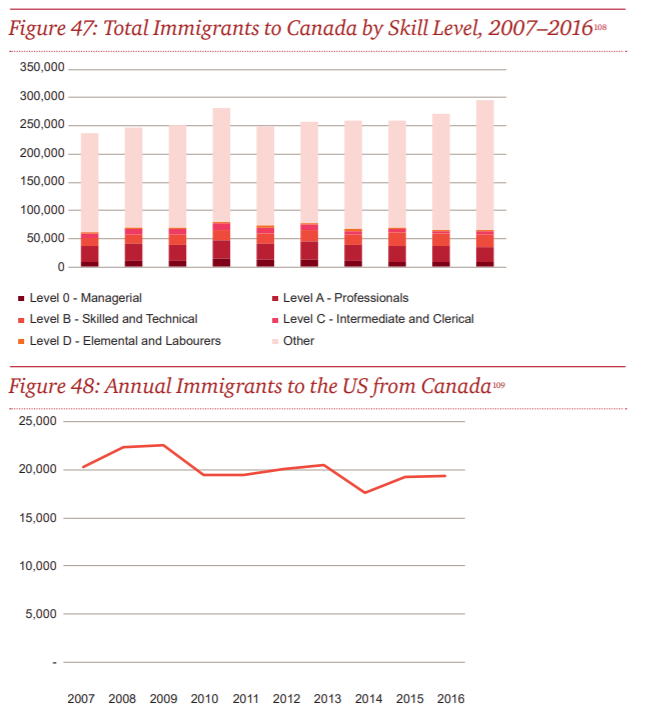
Canadian immigrants to the US are a small group compared to the inflow of immigrants to Canada. However, previous research has shown that the “non-permanent” emigrants (i.e. those with temporary work permits) also have significant impacts on the Canadian economy (Iqbal, 2000).Figure 49 provides the number of admissions of temporary workers and families from Canada to the US from 2011 to 2016. On average, the US granted more than 1.1 million admissions to workers with Canadian citizenship and their families every year. Although this number does not directly measure temporary workers, it reveals that there is a substantial outflow of Canadian skilled labour to the US market.
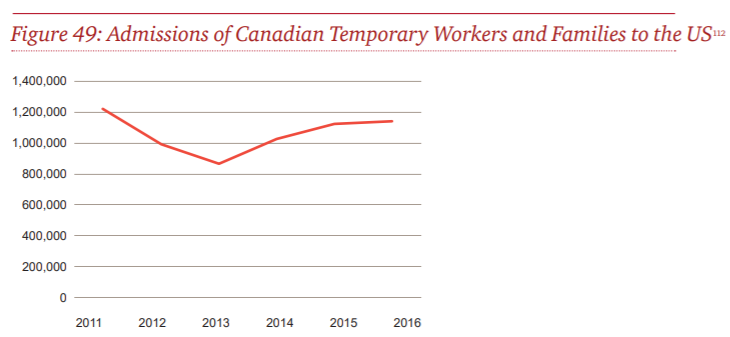
Research in the 1990s called attention to the alarming rate at which newly graduated doctors were moving to the US, with nearly 25% leaving Canada for the US throughout this period (Helliwell, 1999; Zhao et al, 2000; Fennie 2001; Martineau 2004). While past research focused mainly on physicians, a number of recent articles and research have documented the brain drain in the high-tech sector (Yoon, 2017; Loi, 2017; Spicer et al. 2017). A recent profile of the 2016 graduating class of systems design engineering students from the University of Waterloo shows that over 60% of the class secured jobs in the US before graduation (Loi 2017). Spicer et al. (2017) examined brain drain among science, technology, engineering, and mathematics (“STEM”) graduates in top Canadian universities and found that one in five opted to leave Canada and work in the US. As a result, there is a growing perception that while Canada is attracting skilled workers from around the world, it is also losing many of its best and brightest to the US, especially in the high-tech sector.
Factors leading to brain drain
According to past research,113 the following are the top factors that lead to brain drain from Canada to the US, ranked by importance:
- Higher gross income
- Lower tax burden
- Other factors including more growth opportunities, top firms, and leading-edge technology
Higher gross income
Much of Canada’s talent loss has been attributed to migrants seeking higher salaries abroad. The pay level in the US is generally higher than in Canada, especially at the higher skill levels where the Canada-US wage gap tends to be greatest. Thus, the gap of income levels provides a strong “pull” factor for Canadians to move to the US.
In particular, while the per-capita income gap between Canada and the US has narrowed, the gap has remained significant in the high-tech sector (Loi, 2017; Spicer et al., 2017). The table below provides the average salary in the high-tech sector in major metropolitan areas. Compared to other cities, high-tech workers in Toronto earn a relatively low gross salary at 51% of the salary level in the Bay Area of San Francisco. After adjustments for the cost of living, the salary level is still below average.
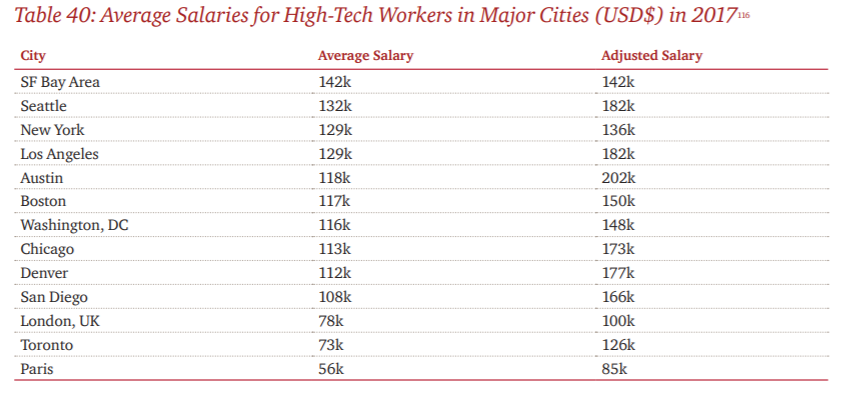
Low personal income tax
Surveys by various research and business organizations also identify another important reason for emigration to the US: lower taxes. Iqbal (2000) conducted an in-depth study of personal taxes between the US and Canada. The figure below compares the total of various taxes as a percentage of gross income for different income levels. As income increases, the gap widens. At the $250,000 level, the total tax payment rises to 41.2% of gross income in Canada but amounts to only 29.7% in the US (a gap of 11.5 percentage points). The major reason for this gap is the high income tax and surtax in Canada.
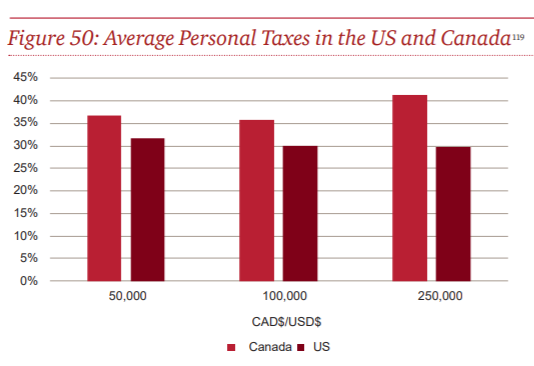
Channels of emigration
In the previous sections, we discussed the major motivations that lead to emigration from Canada to the US. The channel of emigration, which enables skilled workers to move across countries, also affects the level of brain drain. NAFTA has greatly reduced the administrative barriers to the bilateral exchange of skilled workers between Canada and the US and has led to a substantial increase in the level of both temporary and permanent migration of skilled workers between Canada and the US. Currently there are three major US visa options for high-skill technical labour:
- TN. Allows citizens of Canada as NAFTA professionals to work in the US. The TN visa is a non-immigrant visa and can be renewed without limit.
- H1B. Applies to individual positions and allows immigration. This class has a cap of 85,000 to reduce the influx of immigrants and to provide jobs for US citizens. It is most popular for high-skilled labour.
- L1. Applies to intercompany transfers from other countries to the US. There is no cap for L1 visas. There are two classes: L1A for management personnel and L1B for specialized-knowledge workers. The minimum requirement is to work for one year in the affiliated foreign entity of the company.
Canada has been a viable and attractive “back-up” for workers who wish to immigrate to the US. In 2016, the US granted more than 1.14 million admissions to workers from Canada through temporary worker visas such as TN, H1B and L1. Canadian workers received 30% of the total admissions of foreign temporary workers, and this number is the highest among admissions from all other countries.
The US has recently taken a protectionist stance on immigration issues. This may lead US companies to pursue more Canadian workers as skilled workers from other countries become less accessible. However, there is also currently great uncertainty around immigration channels. The renegotiation of NAFTA poses a risk to the future of TN visas, and the US has implemented more strict scrutiny of immigrant and non-immigrant visas.
US tax reform and the brain drain
In recent years, a number of authors and policy makers have been alarmed about human capital flight to high-tech industries in the US (Yoon, 2017; Spicer et al., 2017; Loi, 2017). In this section, we selected the high-tech sector to illustrate the income gap and the impact of US tax reform and assessed the salary and income taxes in a few metropolitan areas where the industries are concentrated.
Changes in 2018 personal income tax in the U.S.
Several significant changes on personal income taxes arise out of the US tax reform:
- Tax brackets and tax rates. Most individual tax rates are lowered in the income tax brackets. The top marginal rate drops to 37% from 39.6%. The income levels to which the rates apply also adjust. Table 41 compares the federal personal income tax rate in 2017 and 2018.
- Personal exemption. The personal exemption has been eliminated in 2018. In 2017, the personal exemption amount was $4,050 for most US resident and non-resident filers.
- Standard deduction. The standard deduction was increased to compensate for the elimination of the personal exemption. For example, for single tax filers, the amount will rise from $6,350 to $12,000.
- Changes to several tax credits and deductions. For example, deduction changes on the student loan interest deduction and home mortgage interest deduction.
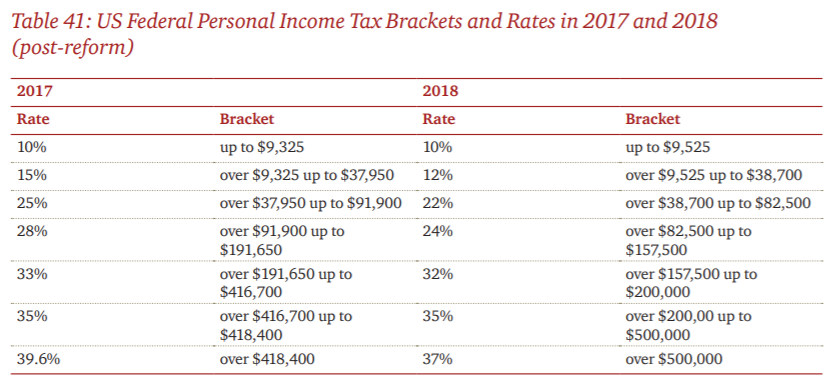
Because of the above changes, federal personal income tax (“PIT”) is expected to decrease for most taxpayers. We select four income levels from $50,000 to $200,000 to illustrate the impact of the Act on payable federal personal income tax. As shown in Table 42, the Act will result in a tax reduction from 2-3% of these income levels.

Case study: brain drain in the high-tech sector
As PIT is a combination of federal, state, provincial and any municipal rates, we have focused our analysis on the centres of high-tech employment in North America.
In this section, we used income in high-tech sector as a baseline to quantify the impact of the Act on after-tax income. We took into account both salary and PIT gaps between the US and Canada and then analyzed the potential impact of the US tax reform on brain drain.
Table 43 lists the average salary in the high-tech sector in major metropolitan areas in Canada and the US. The salary level for employees in the high-tech sector in Toronto was $92,000 CAD in 2017. There is a significant gap between the US and Canadian salary levels, and the gap is further increased by the weak Canadian currency.

We used the above salaries of high-tech workers in 2017 (Toronto, Bay Area, Seattle and New York) to demonstrate the impact of US tax reform on gaps of after-tax income between the US and Canada. We then analyzed the potential outcomes on brain drain because of the US tax reform. We took the following steps to examine the living-cost adjusted income gap between the US and Canada:
- Calculate the federal and provincial PIT and after-tax income in each metropolitan area.
- Convert income to USD and adjust after-tax income for living costs.
- Calculate the income gap between the three metropolitan areas and Toronto.
The above approach will be applied to both 2017 and 2018 to study the impact of the US tax reform. Table 44 provides details of the federal, state/provincial PIT in the US and Canada. Seattle has the highest after-tax income because of its zero state-level PIT.

Figure 51 shows the adjusted income gap between a US metropolitan area and Toronto for the high-tech sector. The aftertax income gap ranges from $35,000 to more than $50,000. Because of the US tax reform, the gap will be further widened by about 7–10%.
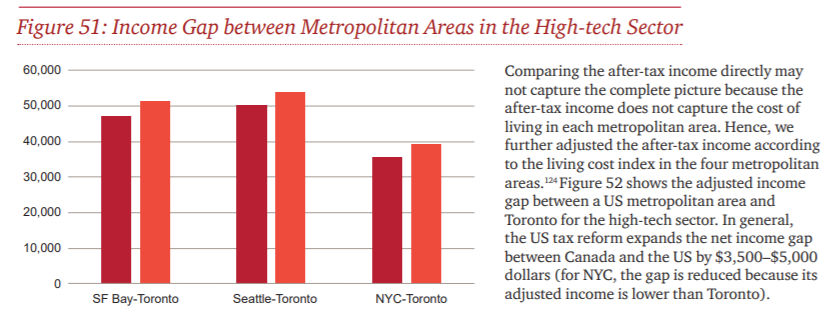
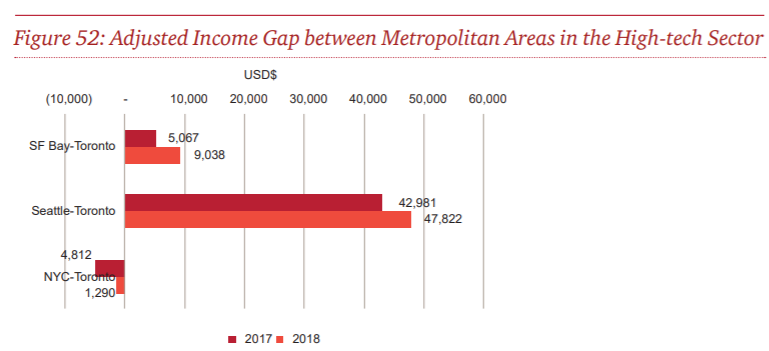
Likely expectations
We expect a relatively small increase in emigration of high-skilled employees from Canada to the US because of the US tax reform. However, this increase, while relatively small, comes on the heels of an already large drain brain phenomenon, and at a time where Canada needs to reverse this trend and increase its attraction of high-skilled employees. Such reversal is key to Canada’s ability to cope with the digital revolution facing us in the next five to ten years.
The US tax reform makes it more difficult to reverse the current brain drain and emphasizes the need to address this issue

Policy Options
Following are some of the policy options that could be considered by Canadian governments in response to the impact of US tax reform on Canada’s competitiveness.
General principles
- Canada could review its corporate and individual income tax regimes to ensure competitiveness. Guiding principles could include effectiveness, neutrality, efficiency and simplicity.
- Canada could gradually reduce its reliance on inefficient and distortive income taxes and increase its reliance on more efficient and less distortive consumption taxes
Specific options
- Tax options
- General corporate income tax measures
- The federal and provincial governments gradually reduce the combined statutory rate to 20% by 1% per year. The gradual rate reduction reduces windfall benefits on existing investments, avoids large-scale expense dumping and makes a bonus depreciation more effective.
- Canada introduces a 100% bonus depreciation for seven years. In the US, the 100% bonus depreciation applies to equipment and certain intangible property. Canada could consider applying the 100% bonus depreciation also to structures and acquired intangibles (e.g., patents).
- Canada introduces a longer loss carry-back period. A longer loss carry-back period would support resource companies whose earnings are cyclical and can be volatile.
- Brain drain counter measures – personal income tax measures
- Canada increases the personal income tax brackets to closer resemble the US personal income tax brackets.
- The federal and provincial governments reduce the combined top marginal statutory rate to 49%.
- Innovation measures
- Canada reviews its SRED program from both an effectiveness and an administration perspective. The SRED program should be compared with R&D programs in other leading innovation countries with the objective of creating a behaviour driving, best-in-class R&D program. One measure Canada could consider is to convert the SRED program from a tax credit program into a direct grant program to mitigate the impact of the GILTI rules for US multinationals performing R&D in Canada. Due to the mechanics of the GILTI calculation, it may be most effective to gross up the R&D grant for Canadian tax purposes and include the grossed-up grant in taxable income.
- Canada introduces an IP regime or “patent box.” Many countries around the world have adopted or are adopting IP regimes under which income from in-country developed IP can benefit from a favourable tax rate. As part of US tax reform, the US has also adopted the FDII rules, which can be considered an IP regime. Under the FDII rules, a US corporation is effectively subject only to a 13.125% – instead of a 21% – tax on income from the export of property and services.
- General corporate income tax measures
- Funding options
- Tax base expansion measures
- Canada continues to expand its corporate income tax base. Examples are (1) modifying the small-business deduction by adopting a lifetime maximum profit amount that can benefit from the small business deduction and (2) limiting the amount of deductible interest to 30% of EBITDA. The US also eliminated its graduated (small business) rate and adopted an interest limitation initially set to 30% of EBITDA.
- The federal and provincial governments further increase the personal income tax base.
- Consumption tax measures
- The federal government gradually increases the GST rate. In addition, to increase competitiveness, provinces that have a legacy sales tax could harmonize their sales tax with the GST and introduce an HST. Provincial governments start with an HST rate that is lower than their legacy sales tax rate and gradually increase their HST rate. As in many countries around the world, consideration could be given to including the GST and HST into the prices charged for goods and services to consumers.
- The federal and provincial governments agree to introduce one unified carbon tax instead, of a cap-and-trade system, and use the revenue to reduce corporate and personal income taxes. This can maintain or even improve Canada’s competitiveness and simultaneously lead to more energy-efficient behaviour.
- Tax base expansion measures
- Other policy options
- Administration of income taxes
- Canada (i.e. the Canada Revenue Agency) significantly improves the efficiency and effectiveness of the administration of Canada’s corporate and personal income taxes.
- Regulatory approvals
- Canada’s federal, provincial and territorial governments significantly simplify and shorten approval processes for large-scale projects and reduce the uncertainty of the outcome of these processes. This can be accomplished without reducing the quality and thoroughness of these important approval processes.
- Administration of income taxes

Conclusion
Prior to US tax reform, Canada’s relatively favourable corporate tax environment was a major advantage in terms of attracting new investment. Due to the US tax reform, this advantage has now disappeared. We have assessed the impact of the US tax reform on nine Affected Sectors and concluded that overall these sectors are likely to face a shift in investment away from Canada and toward the US over the next 10 years. Our quantitative assessment of the portions of these sectors that are at risk is summarized in the table below:
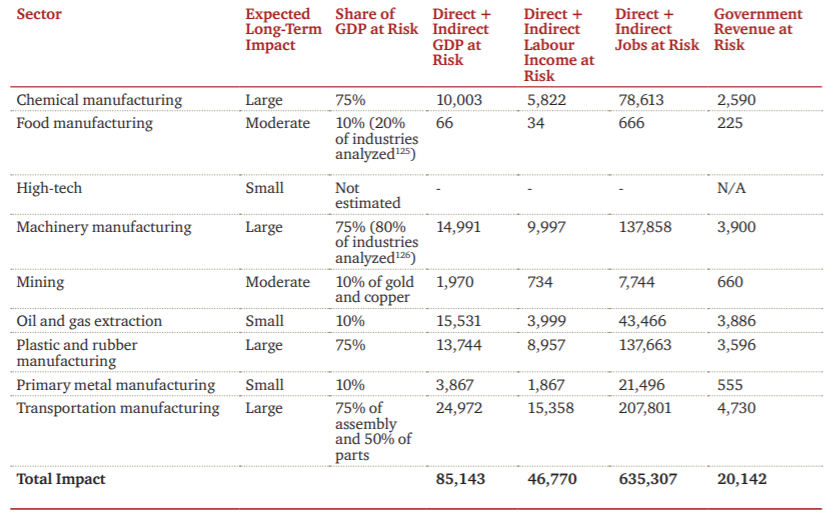
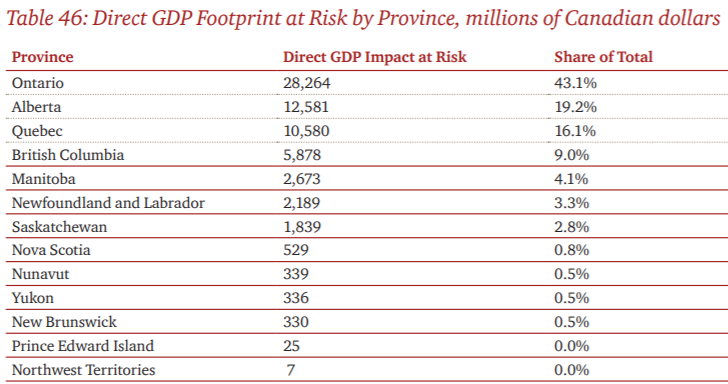
There is a growing digital revolution among many sectors assessed in this report, which is likely to require significant new capital investment in the coming years. Due to Canada’s current competitive disadvantage in those sectors, there is a significant risk that Canada will be left behind in the digital revolution and thereby miss the opportunities presented by this revolution. This additional impact is not reflected in the table above. The US tax reform has also affected Canada’s attractiveness for R&D activity. The US tax reform has decreased the net effectiveness of Canada’s SRED credits for US-based companies and increased the net effectiveness of US R&D credits. This — together with the impact of the GILTI and FDII rules — is likely to lead to a reduction in R&D activity by US-based companies in Canada, including the spill over benefits that such activity creates. We assessed the impact of the decrease in personal income tax rates from the US tax reform. We expect a relatively small increase in the emigration of high-skilled employees from Canada to the US. However, this increase, while relatively small, comes on the heels of an already large drain brain phenomenon and at a time where Canada needs to reverse this trend and increase its attraction of high-skilled employees. This will be key to coping with the digital revolution facing Canada in the next five to 10 years.

Appendix A: References

Appendix B: Tax analysis methodology
The following describes PwC’s analysis of the effective tax rates paid by ten industries in Canada in 2018 in comparison to those paid in the United States in 2017 (before the Tax Cuts and Jobs Act) and 2018 (after the Tax Cuts and Jobs Act).
We assess these by computing effective marginal corporate tax rates (“EMTR”) and effective average corporate tax rates (“EATR”), following the methodology of Devereux and Griffith. The EMTR represents the corporate tax burden on an incremental break-even investment, while the EATR represents the corporate tax burden on projects generating economic rents. The EATR may drive the decision of where to place a specific investment when there is locational choice, while the EMTR may influence the scale of the investment. The analysis considers only national and subnational corporate-level income taxes and does not consider taxes at the level of the shareholder or interest recipient.
The effective tax rate calculations presented in this report take into account the changes in the U.S. law resulting from passage of the Tax Cuts and Jobs Act (“TCJA”) at the end of 2017, including the reduction in the federal corporate statutory tax rate, the repeal of Section 199 domestic production deduction, enhanced (bonus) depreciation allowances for qualified property and the deduction for foreign-derived intangible income (“FDII”). The calculations do not account for other aspects of TCJA. The analysis assumes that US states conform exactly to US federal law for both depreciation and FDII.
The ten sectors for which we calculated effective tax rates include eight manufacturing industries, mining, and oil and gas extraction. The analysis assumes domestic investment in an industry-specific composite asset, consisting of a mix of structures, equipment, inventory, and, in the case of the mining and oil & gas industries, exploration and development expenses, based on industry-level capital stock data from the Bureau of Economic Analysis. The investment is financed by an industry-specific mix of debt and equity with industry-specific pre-tax rates of return (for EATR only), as estimated by PwC Canada. See the methodology section below for a detailed description of parameters used in both countries. For all tax figures presented here, assumptions on rate of return on invested capital and debt/ equity ratio are based on industry averages, and are uniform across jurisdictions. The rates in the “post” rates are based on the assumption that no output is exported, and the “post exports” rates are based on the assumption that 100% of output is exported, giving producers a lower tax rate due to the FDII export credit. The following industry-specific debt/equity ratios and return on invested capital figures were used.
Methodology
We calculated corporate Effective Marginal Tax Rates (EMTRs) and Effective Average Tax Rates (EATRs) for Canada under 2018 law and for the United States under 2017 and 2018 law according to the Devereux-Griffith methodology used by the European Commission (“EC”), including national and subnational corporate income taxes. We excluded all other taxes, such as shareholder taxes and property taxes.
FDII is certain income in excess of a deemed tangible return, defined as 10% of the depreciable asset’s basis, using Alternative Depreciation System (“ADS”) allowances. To account for the 37.5% deduction for FDII, we assumed a pure exporter with a rate of return greater than 10% considering an additional small investment (with either a breakeven return or economic rent). We reduced the federal and state corporate tax rates by the amount of the deduction, accounting for assumptions on state conformity to federal law (see Table 47), resulting in a combined tax rate post-FDII. Then we added an additional tax term to the standard cost of capital formula used by Devereux and Griffith, representing the deemed tangible return, equal to 10 percent of the present value of basis multiplied by the difference between the combined tax rate pre-FDII and the combined tax rate post-FDII. FDII rules specify that basis is determined at the end of each quarter. In this approximation, we assumed the initial measurement of basis is after first period depreciation and is not discounted.
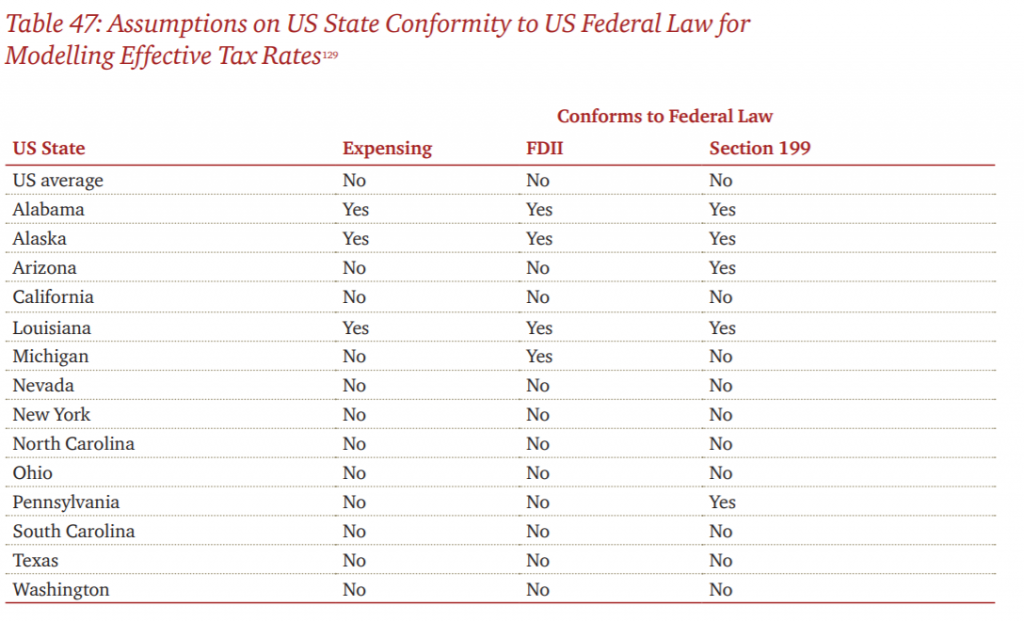
Data for corporate income tax rates are from the OECD database, which combines national and subnational taxes and accounts for deductibility of one against the other. In the case of Canada on average, this results in a combined corporate tax rate of 26.8%. For provincial results, provincial corporate tax rates applicable to manufacturing and other income were used (reduced rate in Ontario for manufacturing but not for mining or oil & gas), as compiled by the Canada Revenue Agency and CCH.
In the case of US corporate tax rates under 2017 law, we reduced the federal corporate income tax rate to account for the domestic production deduction (Section 199), as it applied to each industry. Specifically, according to Internal Revenue Service Statistics of Income (SOI) data for C corporations in tax year 2013 (latest available), the domestic production deduction varied across industries, reducing taxable income by 3.0% (oil and gas extraction) to 7.32% (primary metal manufacturing). For example, for primary metal manufacturing, this amounted to a 2.56 percentage point reduction in
the federal corporate tax rate (reducing it from 35% to 32.44%). The US combined statutory tax rate for primary metal manufacturing in 2017 (after adjusting for the domestic production deduction), assuming an average state corporate income tax rate of 6.01%, is calculated to be 36.50%.
Under 2018 law, we held the average state corporate income tax rate constant at its 2017 value, and compute the US combined statutory tax rate to be 25.75%. For state results in 2017 and 2018, we used state corporate tax rates as compiled by the Tax Foundation, noting these do not account for gross receipts taxes (Ohio, Texas, Washington State), local corporate income taxes, or formulary apportionment.
The analysis assumes investment in an industry-specific composite asset, consisting of a mix of structures, equipment, inventory, and, in the case of the mining and oil & gas industries, exploration and development expenses, based on industry-level capital stock data from the Bureau of Economic Analysis. The investment is financed by an industry-specific mix of debt and equity with industry-specific pre-tax rates of return (for EATR only), as estimated by PwC Canada. The analysis assumes a real interest rate of 5% and inflation of 2%.
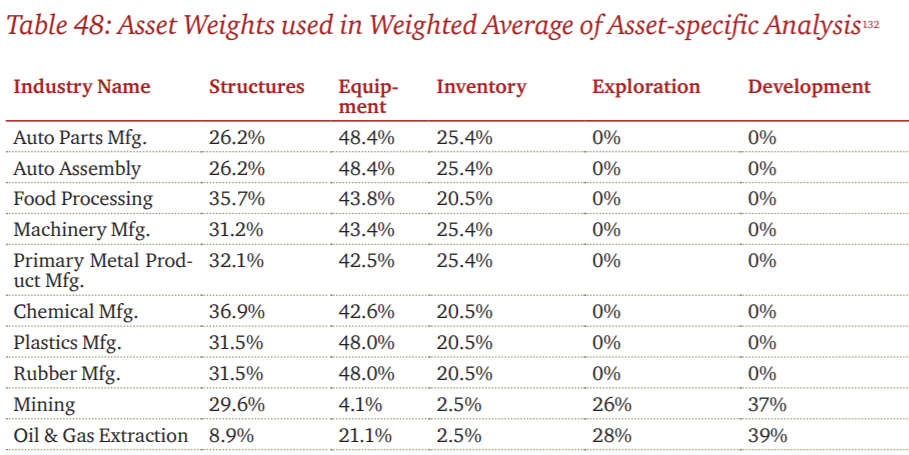
In accordance with other studies utilizing the Devereux-Griffith methodology, we analyzed equipment deemed to have a useful life of 7 years (economic depreciation rate of 17.5%) and structures deemed to have a useful life of 25 years (economic depreciation rate of 3.1%). We assume mining exploration and development (E&D) costs have an economic depreciation rate of 4.5%, based on analysis by the US Treasury Department. We assume oil & gas E&D costs have an economic depreciation rate of 50%, based on analysis of well production rates by the US Energy Information Administration.
For tax purposes in the United States, equipment is assumed 5-year MACRS property (double declining balance with a switch to straight line) and structures are assumed to be 39-year property (straight line). We account for bonus depreciation (expensing) where applicable for equipment. A half-year convention applies to depreciation deductions (but not bonus depreciation or expensing) for the year placed in service. We assume states conform to federal depreciation rules, including bonus depreciation and expensing. Inventories in the United States are assumed to use the LIFO accounting method. We assume 70% of R&D costs are expensed with the remainder amortized over 5 years.
For Canada, we used the equipment and building allowances published by the Canada Revenue Agency. For structures, we assume manufacturing and processing buildings in Class 1 (10% declining balance), with a half year convention.
For manufacturing equipment, we assume Class 53 (50% declining balance), and for mining and oil & gas equipment we assume Class 41 (25% declining balance), each with a halfyear convention. For treatment of inventories in Canada, we assume FIFO, in accordance with analysis by Jack Mintz and his
colleagues at the University of Calgary. We assume mining and oil & gas exploration costs are expensed, while development costs are deducted at a 30% declining balance rate with a half-year convention, in accordance with analysis by Jack Mintz.

Appendix C: US tax reform measures
1. Corporate rate reduction
With the federal corporate tax rate reduction from 35 to 21% and accounting for average state income taxes of 6.1% in 2018, the combined average federal and state corporate income tax rate is currently 25.8%, a reduction from the 38.9% average combined rate under prior law. The current average combined corporate statutory tax rate for the other 34 member countries of the OECD is 23.9% and Canada’s average corporate tax rate is 26.5%.
2. Bonus depreciation
Changes to depreciation under the Act greatly accelerate capital cost recovery for most equipment by providing for 100% expensing of the cost of qualifying assets placed in service on or after September 28, 2017 and before January 1, 2023. After 2022 and before 2027, most equipment will be eligible for partial expensing, with 80% expensing for assets placed in service in 2023 60% in 2024, 40% in 2025, and 20% in 2026. After 2026, most assets are to be recovered under the modified accelerated cost recovery system (“MACRS”).
Qualifying property is generally property with a recovery period of 20 years or less. Certain property with longer production periods (generally property with a recovery period of at least 10 years or transportation property) is eligible for full expensing if placed in service on or before December 31, 2023.
International tax measures
The international tax changes included in the Act represent the most significant reforms to the US tax system. While providing for a new 100% participation (“territorial”) exemption system for some foreign earnings to replace the prior worldwide tax system with deferral, the Act also adopts a new global minimum tax on foreign earnings (“GILTI”), which is paid without deferral, and applies to high-return active foreign income. An additional minimum tax, BEAT, is imposed on certain cross-border deductible payments to related parties. The BEAT is 5% in 2018, 10% 2019-2024, and 12.5% after 2025. It is 11% for banks and securities dealers 6% in 2018 and 13.5% after 2025.
Participation exemption systems are common in most developed countries. The new global minimum tax, GILTI, however, is a more expansive base protection measure than used by other developed countries, which generally limit such measures to passive income and certain specified forms of easily moveable income. As such, it may counteract some of the benefits of the new participation exemption system by imposing current US tax on active foreign earnings.
Other key changes to the US International tax rules include 100% dividends received deduction (“DRD”) for certain qualified foreign-source dividends received by US corporations from foreign subsidiaries, effective for distributions made after 2017, and mandatory repatriation toll tax for accumulated foreign earnings of 15.5% for cash or cash equivalents and 8% for illiquid assets.
4. Global intangible low taxed income (GILTI)
Certain Controlled Foreign Corporation (CFC) income is taxable in the US subject to a deduction for routine returns on investment (10% of Qualified Business Asset Investment). A 50% deduction is then allowed as well as a credit for 80% of Foreign Income Taxes directly relating to the GILTI. The effect of the foregoing is to tax GILTI in the US at half the domestic rate (10.5%) less 80% of any FTC’s directly attributable.
The intent behind GILTI is to discourage income shifting that might occur under the participation exemption system by imposing US tax on high-return income of controlled foreign corporations (CFCs) in excess of a “normal” return when the foreign effective tax rate measured on an aggregated basis across all CFCs is less than 13.125% (from 2018 through 2025) or below 16.4% (after 2025).
The GILTI tax is not designed to account for timing differences between US and foreign taxes and volatile income flows can give rise to double taxation. Because there is no foreign tax credit carryforward or carryback where the timing of the taxation differs between jurisdictions a full foreign tax credit may not be available in the US and could therefore result in double taxation. Nor can a net foreign loss in one year offset positive foreign income in another year (however, recently proposed regulations would propose to provide some carryover mechanism).
A global minimum tax moves the international tax system in the direction of a worldwide tax system, and unlike the prior US worldwide tax system, imposes tax on a current basis on active foreign income without deferral. As a result, GILTI reduces the ability of US companies to compete on equal tax terms in foreign markets with their foreign-based competitors, offsetting at least in part the benefits of the participation exemption system. GILTI can penalize US companies that have acquired high return assets through cross-border mergers and acquisitions and will discourage future
M&A in which the US parent is the acquirer, rather than the target.
5. Base erosion and anti abuse tax (BEAT)
The “base erosion and anti-abuse tax” (“BEAT”) applies to certain “base erosion payments” paid to foreign affiliated companies. Companies subject to the tax would pay the excess of tax computed at a 10% rate (5% in 2018) on an expanded definition of taxable income that adds back the base eroding payment to regular taxable income over their regular tax liability reduced by certain credits. The tax would not apply to companies with “base erosion tax benefits” less than three% of total deductions of the taxpayer. Foreign tax credits are not permitted to reduce this tax.
In addition, the following provisions apply:
- Cost of goods sold is not a deductible payment and would not be a base-erosion payment;
- The BEAT does not apply if the annual average gross receipts for the past 3 years do not exceed $500M or the base erosion percentage (related party deductions over total deductions) is less than 3% (2% for banks and securities dealers);
- The banking and capital markets sector received a significant reprieve from the imposition of the BEAT, with an exclusion for derivatives. However, it is not clear whether the definition of derivatives includes stock loan and repo transactions;
- For in-bound banks, a critical concern is the inclusion of interest payments as applicable to the BEAT and these taxpayers are arguing that such payments are akin to cost of goods sold in the widget sector; and
- Global dealing models employing profit split approaches are particularly complicated given the uncertain nature of the flow of funds depending on booking location and local trading performance. These related party payments may be included in the BEAT calculation.
While the intent of the provision is to prevent base erosion, it applies without any determination that the payment exceeds an arm’s length transfer price. Indeed, the provision can apply even where an existing advance pricing agreement or prior audit has agreed to the transfer price established.
The provision can also apply when the payment is made to a taxpayer in a jurisdiction with a tax rate equal to or higher than the US rate. It does not appear that cross-border payments are netted. For example, a taxpayer could be subject to BEAT on its outbound interest payments even though it has a similar amount of inbound interest income.
The BEAT calculation does not permit any credit for foreign tax imposed on this payment. The provision applies to both US-headquartered companies and foreign-headquartered companies with US operations. As the BEAT applies to cross border related party payments by a US entity strategies to reduce the BEAT could encourage the relocation of the service provider to the USA or moving the US paying entity out of the USA. BEAT can also be avoided by hiring an unrelated foreign party to undertake the activity formerly undertaken by a related foreign party. The EU has asked the OECD to review whether the BEAT is consistent with OECD tax principles.
6. Foreign-derived intangible income (FDII)
Many countries are competing to attract investment Intellectual Property (“IP”) and other high-return investments. These investments constitute a class of highly mobile investments and are very sensitive to lower tax rates. Foreign-derived intangible income (“FDII”) provides a lower tax rate for FDII through a special deduction. The lower tax rate for this income has some similarities and some differences to tax mechanisms established in other countries for the reduced taxation of income earned from certain IP (Patent Box Regimes).
The FDII deduction is intended to compete with these patent box regimes. The calculation of the FDII deduction requires several steps. First, “deemed intangible income,” a concept similar to taxable income, but excluding certain foreign income, domestic oil and gas income and certain other income. Next, FDII is the product of deemed intangible income and the fraction “foreign-derived deduction eligible income” (defined as deduction eligible income derived from the sale of products or services to foreign customers) over deduction eligible income.
The FDII deduction is 37.5% of this amount in 2018 through 2025, and is then reduced to 21.875%. Applying this deduction against the 21% federal corporate tax rate yields an effective federal tax rate of 13.125% in 2018 through 2025 and 16.40625% after 2025.
It is unclear at this time whether individual US States will adopt the FDII deduction. On a federal level the FDII deduction is approximately equal to a 7percentage point reduction to the federal tax rate through 2025 and a 4percentage point reduction after 2025.
Because of the broad impact of the FDII, the EU has asked the OECD to review whether the FDII deduction complies with OECD BEPS agreements or could be considered a harmful tax practice. In addition, because the FDII deduction excludes income from domestic sales, it is possible that the deduction will be challenged in the World Trade Organization as a prohibited export subsidy.
7. Interest expense
Interest Expense deduction, effective for tax years beginning on or after January 1, 2018, will be limited to the sum of business interest income plus 30% of the “adjusted taxable income” of the taxpayer for the taxable year and allowing unused deductions to be carried forward indefinitely. However, for tax years beginning after December 31, 2017 and before January 1, 2022, the Act would “add back” depreciation and amortization.
The denied interest expense can be carried forward indefinitely. Taxpayers with average gross receipts for the three taxable-year periods ending with the prior taxable year that do not exceed $25 million will be exempt from the interest limitation rules. The new interest expense limitation disallows net interest expense that exceeds 30% of adjusted taxable income, which is
measured in a manner similar to EBITDA from 2018-2021 and EBIT from 2022 onward.
A company that envisions itself permanently with excess interest expense could be viewed as facing a marginal tax rate on incremental profits of 14.7% (70% of the federal statutory 21% tax rate), since each additional dollar of profit will allow it to claim 30 cents of suspended interest deductions. This could have the effect of providing an increased incentive to undertake equity-financed investment.
8. Other businesses expenses
a) Hybrid Related Party Payments (Negative Impact for US Entities) Denies deductions relating to certain related party amounts paid or accrued in hybrid transactions by or to hybrid entities.
b) Dividends Received Reduction (Neutral Impact for US Entities) Reduces the current 70% dividend received deduction to 50% (less than 20% ownership in corporation) and the 80% deduction to 65% (more than 20% owned corporation).
c) Net Operating Losses (Negative Impact for US Entities) A limit on net operating loss (NOL) deductions to 80% of taxable income for losses arising in tax years beginning after 2017 NOLs can no longer be carried backwards, but can be carried forward indefinitely.
d) Executive Compensation (Negative Impact for US Entities) US tax reform eliminates certain exceptions to the deductibility of compensation in excess of $1 million on employee remuneration. The rule also imposes a 20% excise tax on certain “excess” compensation received by tax-exempt organization executives. Performance-based compensation is no longer excluded. Covered employers are listed companies or issuers of listed securities. Covered employees are the CEO and CFO who held that office at any time during the year as well as the three most highly paid employees (other than CEO and CFO) that would be reported in the annual proxy statement.
e) Entertainment Expenses (Negative Impact for US Entities) US tax reform denies deductions for certain entertainment expenses and repeals the exclusion for employee achievement awards.
f) Lobbying Expenses (Negative Impact for US Entities) US tax reform no longer allows the deduction for local lobbying expenses.
g) Estate Tax (Positive Impact for US Individuals) The estate tax exemption amounts have been doubled to $11.2 Million through 2025.

Appendix D: Input output methodology
The fundamental philosophy behind economic impact analysis is that spending on goods and services has attendant impacts throughout the economy. For instance, gold production will generate demand for the inputs to this process (such as machinery and labour) that in turn generates additional demand that extends beyond the initial spending. The input-output model used for the purpose of this report estimates the relationship between a particular economic activity for a given good or service and the resulting impacts throughout the economy (including demand for other goods and services and tax revenues). The economic factors were calculated for the following measures of economic activity:
- Value added or GDP – the value added to the economy, or the output valued at basic prices less intermediate consumption valued at purchasers’ prices. GDP includes only final goods to avoid double counting of products sold during a certain accounting period.
- Employment – the number of FTE jobs created or supported.
- Labour income – the amount earned by the employment expected to be generated by existing operations.
Economic impacts are estimated at the direct and indirect levels:
- Direct impacts result from firms’ spending on suppliers and employees.
- Indirect impacts arise from the activities of the firms providing inputs to company’s suppliers (in other words, the suppliers of its suppliers).
- The total economic impact is the sum of the direct and indirect impacts.
We note that direct and indirect impacts also stimulate more household consumption, which is captured by induced impacts. Induced impacts are the result of consumer spending by employees of the businesses stimulated by direct and indirect expenditures. However, the induced impact is calculated based on additional assumptions and tend to overestimate the overall economic impacts. Hence, we include direct and indirect impacts only.
Our analysis permits the estimation of this cascading effect by using the multipliers of the 2014 input-output model from Statistics Canada. For each industry, we assessed the proportion of output that would be affected by the US Tax Reform and transformed it to potential loss in GDP. Then we calculated potential losses of employment and labour income using
the multipliers published by Statistics Canada.
The size and complexity of the Affected Sectors does not allow for an accurate estimate of the portions in those sectors that are at risk of survival in the long term, as a result of the US tax reform. To address this issue, we took a holistic view of each sector, as described in our report. We then used our professional judgement to assess whether a small, moderate or large portion of each sector is at risk. In doing so we excluded industries within those sectors that we concluded are not at any significant risk.
For the purpose of this report, we represent small as 10%, moderate as 50% and large as 75%. While this is a “judgment call,” we believe that it provides a reasonable order of magnitude for policy-making purposes.

Impact on brain drain Appendix E: Limitations
Receipt of new data or facts: PwC reserves the right at its discretion to withdraw or make revisions to this report should we receive additional data or be made aware of facts existing at the date of the report that were not known to us when we prepared this report. The findings are as of August 2018 and PwC is under no obligation to advise any person of any change or matter brought to its attention after such date, which would affect our findings.
Input-output analysis: Input-output analysis (a model used to estimate Gross Domestic Product (“GDP”), labour income and employment impact) does not address whether the inputs have been used in the most productive manner or whether the use of these inputs in this industry promotes economic growth by more than their use in another industry or economic activity. Nor does input-output analysis evaluate whether these inputs might be employed elsewhere in the economy if they were not employed in this industry at the time of the analysis. Input-output analysis calculates the direct, indirect and induced economic impacts that can reasonably be expected to affect the economy based on historical relationships within the economy. This analysis does not take into account fundamental shifts in the relationships within the economy that may have taken place since the last estimation of multipliers by Statistics Canada, nor shifts that may take place in the future.
Use limitations: This report has been prepared solely for the use and benefit of, and pursuant to a client relationship exclusively with the Business Council of Canada (“BCC”). We understand that the BCC may share our report with third parties. The BCC can release this report to third parties only in its entirety and any commentary or interpretation in relation to this report that the BCC intends to release to the public either requires PwC’s written consent or has to be clearly identified as the BCC’s own interpretation of the report. PwC accepts no duty of care, obligation or liability, if any, suffered by the BCC or any third party as a result of an interpretation made of this report by the BCC.
Further, no other person or entity shall place any reliance upon the accuracy or completeness of the statements made herein. In no event shall PwC have any liability for damages, costs or losses suffered by reason of any reliance upon the contents of this report by any person other than the BCC.
This report and related analysis must be considered as a whole: Selecting only portions of the analysis or the factors considered by us, without considering all factors and analysis together, could create a misleading view of our findings. The preparation of our analysis is a complex process and is not necessarily susceptible to partial analysis or summary description. Any attempt to do so could lead to undue emphasis on any particular factor or analysis.


